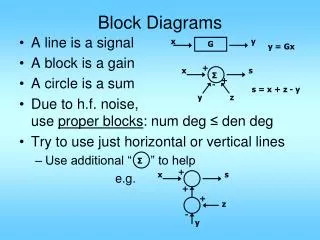
Block Diagrams
Block Diagrams. Diagrams used to describe a complex system in terms of inputs, outputs, and basic functions, processes, devices, or transfer functions that link the inputs and outputs. +. _. Block Diagrams are a form of Abstraction. OP-AMP Schematic Diagram. OP-AMP Symbol.

Block Diagrams
E N D
Presentation Transcript
Block Diagrams Diagrams used to describe a complex system in terms of inputs, outputs, and basic functions, processes, devices, or transfer functions that link the inputs and outputs.
+ _ Block Diagrams are a form ofAbstraction OP-AMP Schematic Diagram OP-AMP Symbol Abstraction is a method of hiding details, either because they are unnecessary, unknown, or get in the way.
+ V+ - V- R1 + 4k R2 + 1k 0 Amplifier with gain = 5 output input Amplifier Circuit Amplifier represented in a block diagram If the relationship between the input and the output of a block can be expressed as a ratio, then that ratio is usually called a transfer function. The transfer function can be a simple number (5 in this example) or it might be a more complex form such as a Fourier or Laplace transform expression.
output input input input output output Integration Integrator Block descriptions are expressed in terms of the function the block performs, the type of device the block represents, or the transfer function of the block. It is best to use a consistent form of description in all blocks in a diagram.
+ sum output output Amplitude modulated radio frequency signal Audio signal Demodulation input input input input input input Select the highest input output input output Square root Blocks that perform simple functions can be described with symbols, but complex functions are usually described with words:
Function blocks are blocks that represent a function, process, transformation, or activity. A diagram composed of groups of function blocks is called a function diagram or a function block diagram. The lines that connect function blocks represent inputs and outputs with distinct characteristics that are usually defined with specifications. Function blocks may have multiple inputs/outputs. A complex system (such as a TV) can be represented by a single function block that summarizes the overall operation, or it can be represented by a diagram consisting of many blocks where each represents a low level function. The level of detail needed is determined by the purpose of the block diagram.
Block diagrams are a method used in design to: • Identify the functions needed to meet design requirements during the early (conceptual) design phase idea block diagram detailed design • Identify signals or variables that need to be defined by specifications • Document or summarize a design when completed detailed design block diagram documentation
Specifications • The characteristics of function block inputs and outputs are defined by specifications • Specifications provide complete, unambiguous information, which may include: • Nature of the input or output (voltage, current, force, temperature, etc) • Scale factor or units (volts per degree, degrees Celsius, etc) • Range (lower and upper limits) • Resolution (smallest distinguishable change) • Accuracy • Noise (nature and level of undesired signals) • Loading limitations
Levels of Specifications • Customer Specifications (defines the customer’s acceptance limits for your product) • Internal Specifications • System (what you design and build to so you meet the customer specifications with some room for performance variations) • Subsystem (what the subassemblies must meet so that they work together when assembled into a system) • Procurement (specifications for all parts purchased from outside suppliers)
convert from Celsius to Fahrenheit TF TC multiply by 9/5 and add 32º TF TC An Example of Block Diagram Representation Consider the process of temperature scale conversion: TF = 9/5 TC + 32º which can be represented at different levels of abstraction by: multiply by 9/5 add 32º TF TC 9/5 TC Note that every input / output must have a label
TC + 9/5 TF 9/5 TC 32º Going to another step of detail provides more information: It is now clear that another variable representing 32º is required If this process were accomplished in an electrical circuit with voltages representing the temperatures, “scale factors” would be assigned to each of the variables to relate voltage to temperature. For example, if both scale factors were 10 mV/degree: VC = (10 mV/ ºC) (TC) and VF = (10 mV/ ºF) (TF)
The inputs and outputs would then be in the form of voltages VC + 9/5 VF 9/5 VC V32º What value should V32º have? V32º = 0.32 volts Class activity - Design a circuit to implement this diagram using OP-AMPs, resistors, a +10 VDC supply and a –10 VDC supply. VC and VF have scale factors of 10 mV/degree. What would change in your design if VF had a scale factor of 20 mV/degree?
C1 R3 R1 0.1 uF 5 K ohms - R2 20 K ohms + VS 2 K ohms + - Vsat = 10 V integrator Schmitt trigger VT Class Activity – analyze the following circuit to determine its operating characteristics and then create a detailed block diagram: