Download
1 / 19
190 likes | 393 Views
An Assessment of Aviation-related Hazardous Air Pollutants from a U.S. airport using CMAQ . Lakshmi Pradeepa Vennam, Saravanan Arunachalam and William Vizuete University of North Carolina at Chapel Hill October 24-26, 2011 10 th Annual CMAS User’s Conference, Chapel Hill, NC.

E N D
An Assessment of Aviation-related Hazardous Air Pollutants from a U.S. airport using CMAQ Lakshmi Pradeepa Vennam, SaravananArunachalam and William Vizuete University of North Carolina at Chapel Hill October 24-26, 2011 10th Annual CMAS User’s Conference, Chapel Hill, NC
OUTLINE • Impacts of Aviation • HAPs Background • CMAQ Modeling • Results and Discussion • Temporal and Spatial trends • Model Evaluation • CMAQ comparison with NATA • Conclusions
Impacts of Aviation • Aviation is one of the fastest growing sector in transportation • Various environmental impacts: -Noise -Air Quality -Water Quality -Climate change • Peer-reviewed literature to-date concentrated on emissions, air quality impacts and modeling of PM2.5(Arunachalamet.al. 2011,Woody et.al.2011, Unal et.al.2005),CO,NOx (Schurmannet.al. 2007), O3(Pison and Menut 2004) • Inadequate attention to Aviation related Hazardous Air Pollutants (HAPs) (ACRP, 2008) Source: FAA Aerospace Forcasts FY 2011-2031, http://www.faa.gov Need to study the air quality impacts of aviation, particularly HAPs
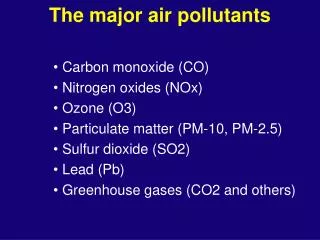
HAPs Background • Definition: The Clean Air Act defines the pollutants that are known or suspected to cause serious health effects as Hazardous Air Pollutants (HAPs) or Air Toxics • 188 pollutants • HAPs are reactive, persistent, bio-accumulative • Key HAPs determined from aviation risk prioritization(Levy et al, 2008 ,PARTNER Report) are: • Formaldehyde, Acetaldehyde, Acrolein • Benzene, 1,3-Butadiene, Toluene, Xylene Source: www.epa.gov HAPs present in lower concentrations, but health risk involved is high
CMAQ Domain • T.F.Green airport (PVD) in Rhode Island, Medium sized airport • 47th largest airport in Nation • 2.5 Million enplanements per year • 4-km CMAQ resolution with 100 x 100 grid cells 4k Enlarged view of CMAQ 4km i.e., 100 x 100 grid cells map Location of PVD airport Northeast US map with CMAQ 4km grid
CMAQ Modeling.. Non-aviation emissions (NEI) SMOKE (Grid based input) Aviation emissions(EDMS) EDMSInv(4D representation) CMAQ (CB05 – extended explicit air toxics chemistry) Two scenarios • Base case(all background sources, except aviation) • Sensitivity case(all sources, aviation sources) Meteorology WRF (annual 2005) Analysis focus on HAPs: HAP - VOCs(Benzene, 1,3-Butadiene,Toluene,Xylene) HAP – Carbonyls(Formaldehyde, Acetaldehyde,Acrolein)
MonitoringSites 4 EPA-AQS Permanent sites, Far-away sites from Airport Pawtucket Providence E.Providence 5 Airport Sites, RI DEM(Rhode Island Department of Environmental Management) W.Greenwich RIDEM study conducted for the period (April 2005- August 2006)
Temporal variability: HAP-VOCs: winter summer HAP- Carbonyls: winter summer • All sources HAP-VOCs : summer to winter 2 – 3 times increase, Toluene is high (due to mobile sources) • Airport HAP-VOCs: 1- 2% all sources, summer to winter modest increase, benzene is high (Timko et.al., 2010, Herndon et.al.,2006)
Carbonyls…. • Acetaldehyde, Acrolein have similar trend as Formaldehyde • Primary: Winter > Summer due to dependency of temperature on the aircraft emissions (Herndon et.al., 2009, APEX 1,2,3, EXCAVATE) • Primary > Secondary for all carbonyls emissions from airport sources (High Formaldehyde emissions) Primary Carbonyls > Secondary Carbonyls in the case of airport sources
Spatial variability: • HAPs at airport site less than Urban site [ Urban > Airport > Rural] • High Formaldehyde concentrations near runaway site (Fieldview) Urban Airport sites Suburban Rural • High underprediction in case of Acrolein at all sites • Monitoring datauncertainties (Leucken et al, 2006). • Highly reactive – challenge for analytical methods. • High degradation of Acrolein and its derivatives – improper handling (Seaman et al, 2006).
Model Performance based on Sites: 1,3-BUTADIENE BENZENE XYLENE TOLUENE
Comparison of CMAQ with NATA: 1-3,Butadiene CMAQ conc with NATA and RIDEM overlay • NATA: National Air Toxics Assessment, comprehensive evaluation of Air toxics in U.S by EPA • NATA 2005used Gaussian Dispersion Model (AERMOD) • CMAQ-12k is used to calculate secondary formation in NATA • Comparison of CMAQ concentrations(all sources) with an overlay of NATA census tract(diamonds in figure) and RIDEM obs data (stars) • For highly reactive pollutants such as 1,3-Butadiene, CMAQ shows better performance For highly reactive pollutants, chemistry-transport model (CMAQ) performs better than NATA.
FORMALDEHYDE ACROLEIN • Both NATA and CMAQ underpredict formaldehyde and acrolein • Formaldehyde: Underprediction in the airport grid cell • Acrolein: Underprediction at all sites
Comparison of NATA(nonroad) to CMAQ airport values: FORM (CMAQ_airport with NATA nonroad overlay) ACRO (CMAQ_airport with NATA nonroad overlay) • In general, airport contributions are should be less than the non-road • In the airport grid cell, CMAQ airport concentrations are same as NATA non-road concentration. Possibility of NATA underpredicting the nonroad concentrations
Conclusions • CMAQ able to predict trends similar to sampling and monitoring studies (Herndon et al, 2006, 2009, APEX1,2,3 and EXCAVATE) conducted near airports • Higher hydrocarbon ( Formaldehyde) concentrations during idling and take off seen at Fieldview (runway site) • Primary carbonyl concentrations more than the secondary for airport sources • CMAQ able to predict the dependency of aircraft concentrations on temperature • HAPs at airport sites less than the urban sites except Formaldehyde • Model is able to predict most of the HAPs with an error between 30- 60% except for Acrolein (high uncertainty) • CMAQ performing better than NATA for highly reactive HAPs
References • Arunachalam.S ., Wang, B., Baek,B.H., Levy, J.I. Effect of Chemistry – Transport Model Scale and Resolution on Population Exposure to PM2.5 from Aircraft Emissions during Landing and Takeoff, Atmospheric Environment, 45 (2011) 1294 – 3300. • Woody.M ., B.H.Baek., Adelman Z., Omary M., Lam F.Y., West J.J., Arunachalam S., 2011. An Assessment of Aviation’s contribution to Current and Future Fine Particulate Matter in United states, Atmospheric Environment, 45 , 3424-3433. • Unal A., Hu,Y., Chang, M.E., Odman, M.T., Russell, G.A., 2005. Airport related emissions and impacts on air quality: Application to the Atlants International Airport, Atmospheric Environment, 39, 5787-5798. • FAA 2011. FAA National forecast FY 2011-2031 by Nan Shellabarger. Available at: http://www.faa.gov/news/conferences_events/aviation_forecast_2011/agenda/media/shellabarger.pdf • D.J., Luecken, W.T., Hutzell, G.L., Gipson, 2006. Development and analysis of air quality modeling simulations for hazardous air pollutants. Atmospheric Environment 40, 5087- 5096 • Herndon S,C., Rogers T., Dunlea E,J., Jayne J,T., Maike-Lye R., Knighton B., 2006. Hydrocarbon Emissions from In-Use Commercial Aircraft during Airport Operations. Environ.Sci.Technol 40, 4406-4413. • Seaman V,Y., Bernett D,H., Cahill T,M., 2007. Origin, Ocurrence, and Source Emission Rate of Acrolein in Residential Indoor Air. Environ. Sci. Technol, 2007, 41, 6940-6946. • Characterization of Emissions from Commercial Aircraft Engines during the Aircraft Particle Emissions eXperiment (APEX) 1 to 3, U.S EPA, October 2009 • Timko ,M,T., Herndon,S,C., Wood,E,C., Onasch,T,B., Northway,M,J., Jayne,J,T., Canagaratna,M,R., Miake-Lye,R,C., 2010, Gas Turbine Engine Emissions – Part I: Volatile Organic Compounds and Nitrogen Oxides, Journal of Engineering for Gas Turbines and Power, 2010, Vol.132.
Acknowledgements • Rhode Island Department of Environmental Management (RIDEM) • Deborah Luecken, USEPA The Partnership for Air Transportation Noise and Emissions Reduction is an FAA/NASA/Transport Canada/US DOD/EPA-sponsored Center of Excellence. This work was funded by FAA and Transport Canada under 07-C-NE-UNC Amendment Nos. 001 to 004, and 09-CE-NE-UNC Amendment Nos. 001-003. The Investigation of Aviation Emissions Air Quality Impacts project is managed by Christopher Sequeira. Any opinions, findings, and conclusions or recommendations expressed in this material are those of the author(s) and do not necessarily reflect the views of the sponsors.