Download
1 / 15
150 likes | 283 Views
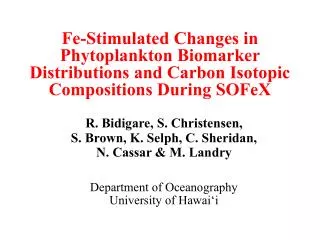
Fe-Stimulated Changes in Phytoplankton Biomarker Distributions and Carbon Isotopic Compositions During SOFeX. R. Bidigare, S. Christensen, S. Brown, K. Selph, C. Sheridan, N. Cassar & M. Landry Department of Oceanography University of Hawai‘i. Research Objectives.

E N D
Fe-Stimulated Changes in Phytoplankton Biomarker Distributions and Carbon Isotopic Compositions During SOFeX R. Bidigare, S. Christensen, S. Brown, K. Selph, C. Sheridan, N. Cassar & M. Landry Department of Oceanography University of Hawai‘i
Research Objectives • Investigate phytoplankton community responses to four sequential iron enrichments (0.7 nM each) at 66°S, 172°W (“Southern Patch”) • Monitor pigment biomarker distributions and d13C ratios in the “Southern Patch” and at outside stations to infer Fe-stimulated changes in algal biomass, composition and growth physiology
HPLC TChl a Turner Chl 4000 SOFeX Southern Patch (R/V Melville) 3000 2000 We hypothesize that the variable positive bias observed in the Fl Chl measurements result from the accumulation of fluorescent zooplankton grazing products (Steryl Chlorin Esters???) HPLC TChl a (ng L-1) 1000 0 0 1000 2000 3000 4000 TChl a = Chl a + Chlorophyllide a Turner Chloropigment (ng L-1)
SOFeX Southern Patch 0 Pre 4.74 d 6.66 d -30 8.99 d 9.08 d 9.18 d (m) -60 9.27 d 10.80 d Depth 14.11 d -90 14.65 d 17.68 d 20.14 d -120 20.75 d -150 0 500 1000 1500 2000 2500 3000 Total Chlorophyll a (ng L-1)
SOFeX Southern Patch (0-30 m) 3000 Pre Out 2500 In 2000 1500 Total Chlorophyll a (ng L-1) 1000 500 0 -2 3 8 13 18 23 28 Time Since Initial Fe Addition (days)
SOFeX Southern Patch (0-30 m) 1500 Pre Out In 1200 900 Fucoxanthin (ng L-1) 600 300 0 -2 3 8 13 18 23 28 Time Since Initial Fe Addition (days)
SOFeX Southern Patch (0-30 m) 0.7 Pre Out 0.6 In 0.5 0.4 DDX+DTX / S FUCOX+PER 0.3 0.2 0.1 0 -2 3 8 13 18 23 28 Time Since Initial Fe Addition (days) Photoadaptation Index
SOFeX Southern Patch 50 40 30 Daily PAR (Ein m-2) 20 10 0 4 5 6 7 8 9 10 11 12 13 14 15 16 17 18 19 20 21 Time Since Initial Fe Infusion (days)
SOFeX Southern Patch (0-30 m) 8 7 y = 0.095x + 5.608 r2 = 0.84 6 Ln (Biomass) 5 y = 0.058x + 3.778 r2 = 0.83 4 Chl C 3 0 5 10 15 20 25 Time Since Initial Fe Addition (days) Phytoplankton Net Growth Rate
Apparent Phytoplankton Net Growth Rates During SOFeX (Southern Patch)
SOFeX Southern Patch 1.2 ‰) ( 0.8 OUT C 0.4 13 d - IN 0 C 13 d -0.4 4 7 10 11 15 18 21 Time Since Initial Fe Infusion (days) Bulk POC (mixed layer)
Summary • Fe enrichment produced an 10-fold increase in [TChl a] in the SOFeX Southern Patch (0.2 2.0 mg/m3) • Only small changes in phytoplankton size structure were observed following Fe enrichment ( >20 mm size fx) • Variations in xanthophyll cycle pigment ratios indicate that light limitation may have restricted the magnitude of the phytoplankton response to Fe addition • A differential response to Fe enrichment was observed for the Southern Patch phytoplankton community with diatoms > pelagophytes > dinoflagellates > haptophytes • A ~1‰ enrichment in 13C was measured in the POC pool in the Southern Patch relative to the outside stations
Future Directions • Identify fluorescent grazing products • d13C biomarker analyses • Lipids (irmGC/MS) • Pigments (irmLC/MS) • SOFeX large-volume pump samples • Phytoplankton “soup” samples • AESOPS sediment core samples