Download
1 / 49
490 likes | 508 Views
This is a study on the application of prototype-based classifiers and relevance learning in the biomedical field. It explores the use of supervised learning techniques for classification, regression, and prediction based on labeled example data. The study also discusses the significance of interpretable "white-box" systems and compares different performance measures for evaluating classifier models.

E N D
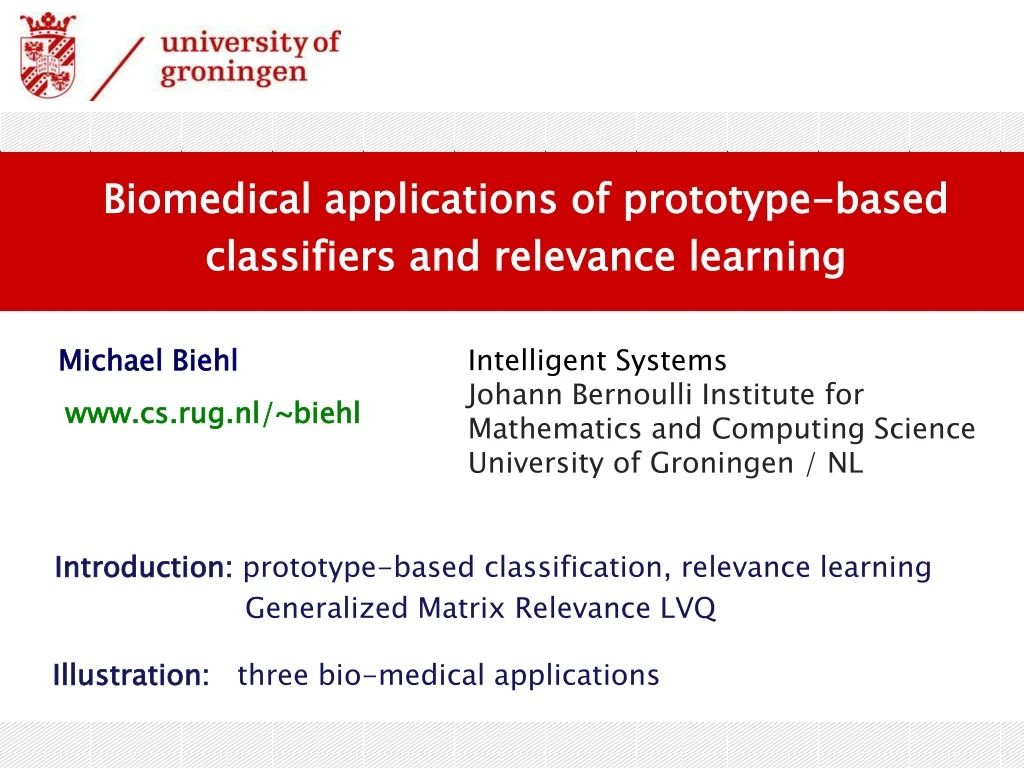
Biomedical applicationsof prototype-based classifiersandrelevancelearning Michael BiehlIntelligent Systems Johann Bernoulli Institute for Mathematics and Computing Science University of Groningen / NL www.cs.rug.nl/~biehl Introduction: prototype-based classification, relevance learning Generalized Matrix Relevance LVQ Illustration: three bio-medical applications
supervised learning • classification/ regression / prediction • based on labeledexample data generic workflow: example data model apply to novel data working training validation estimate working performance set parameters of model / training compare different models obvious performance measures: overall / class-wise accuracy ROC, Precision Recall ... accuracy is not enough - interpretable “white-box” systems example: prototype-based models, distance-based classifiers
distance-based classifiers a simple distance-based system: (K) NN classifier • store a set of labeled examples • classify a query according to the • label of the Nearest Neighbor • (or the majority of K NN) • piece-wise linear decision • boundaries according • to (e.g.) Euclidean distancefrom all examples ? N-dim. feature space • expensive (storage, computation) • sensitive to mislabeled data • overly complex decision boundaries +conceptually simple, + no training phase + only one parameter (K)
prototype-based classification Learning Vector Quantization [Kohonen, 1990] • represent the data by one or • several prototypes per class • classify a query according to the • label of the nearest prototype • (or alternative schemes) ? • local decision boundaries acc. • to (e.g.) Euclidean distances +robust, low storage needs, little computational effort N-dim. feature space + parameterization in feature space, interpretability - model selection: number of prototypes per class, etc. requires training: placement of prototypes in feature space
Learning Vector Quantization N-dimensional data, feature vectors ∙identification of prototype vectors from labeled example data ∙distance based classification (e.g. Euclidean) competitive learning: LVQ1 [Kohonen, 1990] •initialize prototype vectors for different classes • present a single example • identify the winner (closest prototype) •move the winner -closertowards the data (same class) -away from the data (different class)
Learning Vector Quantization N-dimensional data, feature vectors ∙identification of prototype vectors from labeled example data ∙distance based classification (e.g. Euclidean) ∙distance-based classification [here: Euclidean distances] ∙tesselation of feature space [piece-wise linear] ∙aim: discrimination of classes ( ≠ vector quantization or density estimation ) ∙generalization ability correct classification of new data
cost function based LVQ one example: Generalized LVQ (GLVQ) cost function [Sato&Yamada, 1995] minimize two winning prototypes: Efavors - small number of misclassifications, e.g. with - large margins between classes - small , large - class-typical prototypes
LVQ distance measures ? key question: appropriate distance / (dis-) similarity measure fixed, pre-defined distance measures: (G)LVQ can formulated for general (differentiable) distances examples: Minkowski distances (p≠2), correlation based, statistical divergences, ... not necessarily metrics! standard work-flow - consider several distance measures according to prior knowledge - compare performances in, e.g., cross-validation elegant approach: Relevance Learning / adaptive distances - employ parameterized distance measure - optimize in the data-driven training process (cost function!)
GMLVQ Generalized Matrix Relevance LVQ: [Schneider, Biehl, Hammer, 2009] generalized quadratic distancein LVQ:
GMLVQ Generalized Matrix Relevance LVQ: [Schneider, Biehl, Hammer, 2009] generalized quadratic distancein LVQ: training: adaptation of prototypes and distance measure guided by GLVQ cost function variants: one global, several local, class-wise relevance matrices diagonal matrices: single feature weights [Hammer et al., 2002] rectangular low-dim. representation / visualization [Bunte et al., 2012]
interpretation after training: prototypes represent typical class properties or subtypes • summarizes • the contribution of a single dimension • the relevance of original features in the classifier Relevance Matrix quantifies the contribution of the pair of features (i,j) to the distance Note: interpretation assumes implicitlythat features have equal order of magnitude e.g. after z-score-transformation → (averages over data set)
three application examples I) steroid metabolomics: - detection of malignancy in adrenocortical tumors based on urinary steroid metabolite excretion GMLVQ: ~ 150 samples, 32-dim. feature vectors II) cytokine expression data: - diagnosis of (early) rheumatoid arthritis based on synovial tissue samples ~ 50 samples represented by 117 cytokine expressions in synovial tissue, PCA+GMLVQ combined III) gene expression data: - recurrence risk prediction from tumor samples ~ 400 samples, ~20000 dim. feature space outlier analysis + GMLVQ on (80) pre-selected genes
Steroid metabolomics: detectingmalignancyin adrenocorticaltumors www.ensat.org W. Arlt, M. Biehl, A. Taylor, S. Hahner, R. Libé, B. Hughes, P. Schneider, D. Smith, H. Stiekema, N. Krone, E. Porfiri, G. Opocher, J. Bertherat, F. Mantero, B. Allolio, M. Terzolo, P. Nightingale, C. Shackleton, X. Bertagna, M.Fassnacht, P. Stewart Urine Steroid Metabolomics as a Biomarker Tool for Detecting Malignancy in Patients with Adrenal Tumors J Clinical Endocrinology & Metabolism 96:3775-3784 (2011)
steroid metabolomics • classification of adrenocorticaltumors (adenoma vs. carcinoma) • based on steroid hormone excretion profiles benign ACA malignant ACC features: 32 steroidmetaboliteexcretionvalues non-invasive measurement (24 hrs. urinesamples) www.ensat.org aim:develop a novel biomarker tool for differential diagnosis idea: identify characteristic steroid profiles (prototypes)
steroid metabolomics [Arlt et al., 2011] [Biehl et al., 2012] Generalized Matrix LVQ , ACCvs. ACAclassification ∙data divided in 90% training, 10% test set, (z-score transformed) ∙determine prototypes typical profiles (1 per class) ∙adaptive generalized quadratic distance measure parameterized by ∙apply classifier to test data evaluate performance (error rates, ROC) ∙repeat and average over many random splits
steroid metabolomics prototypes: steroid excretion in ACA/ACC ACA ACC
steroid metabolomics Relevance matrix … of pairs of markers relevance of single markers frequency of markers to be among top 9 subset of selected steroids ↔ technical realization (patented, UoB) using9 markers only, similar ROC
steroid metabolomics ROC characteristics clear improvement due to adaptive distances 90% / 10% randomized splits of the data in training and test set averages over 1000 runs (sensitivity) AUC 0.87 0.93 0.97 Euclidean diagonal rel. full matrix (1-specificity)
steroid metabolomics Relevance matrix diagonal elements off-diagonal 19 ACA ACC discriminative e.g. steroid 19 (THS)
steroid metabolomics TH-Doc (12) highly discriminative combination of markers! weakly discriminative markers 5a-THA (8)
adrenocortical tumors GRLVQ (sensitivity) GMLVQ AUC 0.87 0.93 0.97 Euclidean 8 diagonal rel. full matrix (1-specificity)
visualization of the data set generic property: relevance matrix becomes highly singular ACA ACC
work in progress • high-throughput LC/MS assay to replace GC/MS • on-going prospective study w.r.t. ~ 2000 patients • monitoring of patients after surgeryand/or under medication aim: recurrence detection / prediction • identification of tumor subtypes ? • other disorders affecting / related to steroid metabolism
Early diagnosisof Rheumatoid Arthritis L. Yeo, N. Adlard, M. Biehl, M. Juarez, M. Snow C.D. Buckley, A. Filer, K. Raza, D. Scheel-Toellner Expression of chemokines CXCL4 and CXCL7 by synovial macrophages defines an early stage of rheumatoid arthritis Annals of the Rheumatic Diseases75:763-771 (2016)
rheumatoid arthritis (RA) uninflamed control early inflammation established RA resolving early RA ultimate goals: understand pathogenesis and mechanism of progression ? cytokine based diagnosis of RA at earliest possible stage ?
synovial tissue cytokine expression synovium tissue section mRNA extraction real-time PCR • panel of 117 cytokines • cell signaling proteins • regulate immune response • produced by, e.g. • T-cells, macrophages, • lymphocytes, fibroblasts, etc.
GMLVQ analysis • pre-processing: • log-transformed expression values • 21 leading principal components explain 95% of the variation • Twotwo-class problems: (A) established RA vs. uninflamed controls • (B) early RA vs. resolving inflammation • 1 prototype per class, global relevance matrix, distance measure: • leave-two-out validation (one from each class) • evaluation in terms of Receiver Operating Characteristics
Matrix Relevance LVQ diagonal relevances leave-one-out (A) established RA vs. uninflamed control true positive rate false positive rate diagonal Λiivs. cytokine index i (B) early RA vs. resolving inflammation true positive rate
protein level studies CXCL4 chemokine (C-X-C motif) ligand 4 CXCL7 chemokine (C-X-C motif) ligand 7 direct study on protein level, staining / imaging of sinovial tissue: macrophages : predominant source of CXCL4/7 expression • high levels of CXCL4 and • CXLC7 in early RA • expression on macrophages • outside of blood vessels • discriminates • early RA / resolving cases
relevant cytokines leave-one-out diagonal relevances (A) established RA vs. uninflamed control true positive rate false positive rate diagonal Λiivs. cytokine index i macrophage stimulating 1 (B) early RA vs. resolving inflammation true positive rate
work in progress • more samples (difficult...) needed in order • to obtain a reliable early diagnosis • integrated analysis of gene expression and other data • from the same / an analogous patient cohort
Predicting Recurrence in Clear Cell Renal Cell Carcinoma Analysis of TCGA data using Outlier Analysis and GMLVQ Gargi Mukherjee … Rutgers University, New Jersey Kevin Raines … Stanford University, California SrikanthSastry… JNC, Bengaluru, India Sebastian Doniach… Stanford University, California Gyan Bhanot … Rutgers University, New Jersey Michael Biehl … University of Groningen, The Netherlands In: Proc. IEEE Congress on Evolutionary Computation CEC 2016
data clear cell Renal Cell Carcinoma (ccRCC) publicly available datasets: The Cancer Genome Atlas (TCGA) cancergenome.nih.gov also hosted at Broad Institutegdac.broadinstitute.org
data clear cell renal cell carcinoma TCGA data @ BroadInstitute mRNA-Seqexpressiondata X normalized, log-transformed: Y=log(1+X) 65 normal samples 65 matched tumor samples 469 tumor samples in total 469 tumor samples 65 normal samples 20532 genes recurrence data: daysafter diagnosis numberof recurrences 65 + 65 matched
outlier analysis 380 training samples 89 test samples fast forwardto machinelearning analysis randomizedsplit
outlier analysis per gene: determine mean μ, standard deviation σ of Y for each gene: identify outlier samples 380 training samples Y > μ + σ“high outlier“ Y < μ - σ“lowoutlier“ restrictthefollowinganalysisto genes with ≥ 20 high outlier samples or ≥ 20 low outlier samples
outlier analysis Kaplan-Meier (KM) analysisper gene: test for significant association ofoutlierstatusofsampleswith recurrence 1546 „high-outlier genes“ with KM log rank p < 0.001 1628 „low-outlier genes“ with KM log rank p < 0.0005 1546 genes construct two binary outlier matrices „1“ for high-outlier samples „0“ else „1“ for low-outlier samples „0“ else 380 samples PCA 1628 genes 380 samples
outlier analysis high outlier genes PCA reveals four clusters of genes genes in small clusters (B,D): outlierstatus associated with late recurrence 1475 71 A B lowoutlier genes genes in large clusters(A,C): outlierstatus associated with early recurrence 1402 226 C D
recurrence risk score top 20 genes (by KM p-value) fromeachclusterA,B,C,D referencesetof 80 genes foreach sample: - determineoutlierstatusw.r.t. the 80 genes (Y>?<μ ± σ ) - addupcontributions per gene - 1 if sample isoutlierw.r.t. to a gene in A or C (earlyrec.) 0 if sample is not an outlierw.r.t. thegene + 1 if sample isoutlierw.r.t. to a gene in B or D (laterec.) recurrence risk score - 40 ≤ R ≤ + 40 observe: median = 2 over the 380 training samples crisp classification w.r.t. recurrence risk: high risk (early recurrence) if R < 2 low risk (late recurrence) if R ≥ 2
recurrence risk prediction KM plots with respect to high / low risk groups: training set (380 samples) test set (89 samples) log rank p < 1.e-16 log rank p < 1.e-4 • risk score R is predictive of the actual recurrence risk • the 80 selected genes can serve as a prognostic panel
extreme case analysis outlieranalysisyields 4 groups(A,B,C,D) of 20 pre-selected genes associatedwithlate/earlyrecurrence • 80-dim. feature vectors ≤ 2 years (early) numberof recurrences: > 5 years (undefined) (late or no recurrence) 2 classes: 109 samples class 2, high risk 107 samples class 1, low risk
GMLVQ classifier • one prototype vector per class: • adaptive distanceforcomparisonofsamplesandprototypes: diagonal elements of Λ components of C A B D B A C D low expression | high expression
GMLVQ classifier ROC of GMLVQ classifier (Leave-One-Out of the 216 extreme samples) log rank p < 1.e-7 KM plot w.r.t. all 469 samples ( L-1-O for 216 samples, plus 253 undefined )
diagnostics? • the set of 80 genes is also diagnostic: • GMLVQ separates normal from tumor cells (close to) perfectly • PCA of corresponding gene expressions: gradient from normal to high risk: 65 normal samples 105 low risk samples (late rec.) 109 high risk samples (early rec.)
most relevant genes (GMLVQ) 12 most relevant genes from GMLVQ classifier
remarks and open questions • prospective studies • 80 genes do not necessarily reflect biological mechanismscompare, e.g., with known pathways / modules of genes • GMLVQ suggests an even smaller panel of genes (12?) • identify a minimum panel for diagnostics and prognostics • more direct, multivariate identification of relevant genes by • dimension reduction + GMLVQ with back-transform
conclusion prototype- and distance based systems: - intuitive, transparent, interpretable - classification, regression, unsupervised learning, visualization ... - relevance learning: further insight into data and problem - suitable for a variety of bio-medical problems a recent review: M. Biehl, B. Hammer, T. Villmann Prototype-based models in Machine Learning Advanced Review in: WIRES Cognitive Science 7(2): 92-111 (2016)
links Matlab code: Relevance and Matrix adaptation in Learning Vector Quantization (GRLVQ, GMLVQ and LiRaM LVQ): http://matlabserver.cs.rug.nl/gmlvqweb/web/ A no-nonsense beginners’ tool for GMLVQ: http://www.cs.rug.nl/~biehl/gmlvq (see also: Tutorial, Thursday 9:30) Pre- and re-prints etc.: http://www.cs.rug.nl/~biehl/
thanks Barbara Hammer Thomas Villmann WiebkeArlt Dagmar Scheel-Toellner GyanBhanot Petra Schneider Kerstin Bunte