Download
1 / 30
300 likes | 468 Views
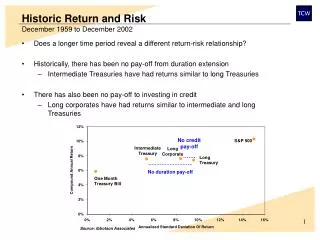
Historic Return and Risk December 1959 to December 2002. Does a longer time period reveal a different return-risk relationship? Historically, there has been no pay-off from duration extension Intermediate Treasuries have had returns similar to long Treasuries

E N D
Historic Return and RiskDecember 1959 to December 2002 • Does a longer time period reveal a different return-risk relationship? • Historically, there has been no pay-off from duration extension • Intermediate Treasuries have had returns similar to long Treasuries • There has also been no pay-off to investing in credit • Long corporates have had returns similar to intermediate and long Treasuries No credit pay-off ……. S&P 500 Intermediate Treasury Long Corporate Long Treasury ……………………… No duration pay-off One Month Treasury Bill Source: Ibbotson Associates
Fixed Income Investment ChoicesDecember 1988 to December 2002 • For some investors cash is the “safe” asset • A look at historical return and risk suggests two fixed income conclusions • Investment grade bond returns have been essentially the same, and • Fixed income investors have only had one choice to make • How much return volatility to take Lehman Aggregate Lehman Credit Lehman MBS Lehman Government Treasury Bill Note: Lehman duration data begin Dec. 1988.
Is Yield the Best Predictor of Future Return?Average Credit Ratings And YieldDecember 1988 to December 2002 • Many investors believe that, in the long-run, higher yield should translate into higher return • Typically, higher yield is associated with higher credit risk • Credit losses, though, may diminish a yield advantage • Have higher yields translated into higher return? Credit C Credit B MBS Credit BB Credit AAA Credit BBB Credit A Credit AA US Government Source: Merrill Indices, Bloomberg AA A BBB BB B C AAA
Is Yield the Best Predictor of Future Return?Average Credit Ratings And YieldDecember 1988 to December 2002 • Historically, investors have had a hard time forecasting credit losses • As a result, higher yield has not been a source of higher return • Rather it has been a source of opportunity cost Credit AAA Credit AA Credit A MBS Credit BBB Credit BB US Government Credit B Credit C Source: Merrill Indices, Bloomberg AA A BBB BB B C AAA
Historical Pay-Off to Sector DiversificationDecember 1988 to December 2002 • For many investors, the government sector is the “safe” fixed income sector • Historically, the credit sector has had the same return as 5-7 years Government bonds • Historically, the mortgage sector has had: • Return volatility similar to three year governments, and • Outperformed comparable duration governments by about 50 basis points per annum US Government 10+ Years US Credit LehmanAggregate US Government 7-10 Years US Government 5-7 Years Lehman US MBS US Government US High Yield US Government 3-5 Years US Government 1-3 Years Three Month Treasury Bill
Historic Return And RiskDecember 1925 to March 2003 • lkjlkjljlj S&P 500 No credit pay-off ……. Long Corporate Intermediate Treasury Long Treasury ……………………… No duration pay-off One Month Treasury Bill Inflation
Historic Return And RiskDecember 1959 to March 2003 • Does a longer time periodreveal a different return-risk relationship? • Historically, there has been no pay-off from duration extension • Intermediate Treasuries have had returns similar to long Treasuries • There has also been no pay-off to investing in credit • Long corporates have had returns similar to intermediate and long Treasuries No credit pay-off ……. S&P 500 Intermediate Treasury Long Corporate Long Treasury One Month Treasury Bill ……………………… No duration pay-off Inflation Source: Ibbotson Associates
Historical Return And RiskDecember 1925 to March 2003 Long Corporate S&P 500 One Month Treasury Bill Long Treasury Intermediate Treasury Note: Data source Ibbotson Associates. Methodology: create two vectors of real returns conditional on the contemporaneous real return of the S&P 500. One vector represents asset returns when the stock market real return is above average, the other represents returns when equity real returns are below average.
Historical Return And RiskDecember 1925 to March 2003 Intermediate Treasury Long Corporate Long Treasury One Month Treasury Bill Note: Data source Ibbotson Associates. Methodology: create two vectors of real returns conditional on the contemporaneous real return of the S&P 500. One vector represents asset returns when the stock market real return is above average, the other represents returns when equity real returns are below average.
Historical Return And RiskDecember 1925 to March 2003 One Month Treasury Bill Long Corporate Long Treasury S&P 500 Intermediate Treasury Note: Data source Ibbotson Associates. Methodology: create two vectors of real returns conditional on the contemporaneous real return of the S&P 500. One vector represents asset returns when the stock market real return is above average, the other represents returns when equity real returns are below average.
Historical Treasury Returns When Treasury Index Rates Rise Or FallContemporaneous, December 1988 to April 2003
Historical Treasury Returns After Treasury Index Rates Rise Or FallOne Month Lag, December 1988 to April 2003
Historical Returns After Treasury Index Rates Rise One Month Lag, December 1988 to April 2003
Historical Returns After Treasury Index Rates Rise One Month Lag, December 1988 to April 2003 Return In Excess Of T-Bill
Historical Returns NBER Expansion/RecessionContemporaneous, December 1988 to April 2003Return In Excess Of T-Bill
Historical Returns Positive Yield CurveOne Month Lag, December 1988 to April 2003Return In Excess Of T-Bill
Historical Returns Yield Curve Above In Sample AverageOne Month Lag, December 1988 to April 2003Return In Excess Of T-Bill
Historical Returns Yield Curve Above Trailing Twelve Month AverageOne Month Lag, December 1988 to April 2003Return In Excess Of T-Bill
Historical Returns Five Year CMT Rates RiseOne Month Lag, December 1988 to April 2003Return In Excess Of T-Bill
Historical Returns Three Month CMT Rates RiseOne Month Lag, December 1988 to April 2003Return In Excess Of T-Bill
Historical Returns Three Month CMT Above One Year AverageOne Month Lag, December 1988 to April 2003Return In Excess Of T-Bill
Historical Returns S&P 500 Returns PositiveOne Month Lag, December 1988 to April 2003Return In Excess Of T-Bill
Historical Returns S&P 500 PE Above One Year AverageOne Month Lag, December 1988 to April 2003Return In Excess Of T-Bill
Historical Returns BAA-AAA Spread Above One Year AverageOne Month Lag, December 1988 to April 2003Return In Excess Of T-Bill
Historical Returns BAA-AAA IncreaseOne Month Lag, December 1988 to April 2003Return In Excess Of T-Bill
Historical Returns Growth Outperforms ValueOne Month Lag, December 1988 to April 2003Return In Excess Of T-Bill
Claude,I would like to concentrate on the graphs on pages 1, 2, 4, and 5.Basically, we will cut the data into two buckets, A and B and graph the curves for these (on the same graph, i.e. there willbe two curves, sample A and sample B).1. A=NBER recessions (Peak to Trough), B=NBER expansions (Trough to Peak) http://www.nber.orgAll of the next graphs are predicitve. We observe a state and then take a position the next month.2. Term structure inversions (5yr-3mo Treasury yield). A=Inversion (sample the month *after* inversion, i.e. if term structure inverts in Feb, March goes into A, if it returns to positive slope in September, A will include March-September, October will go to B. This way, we are operating on an ex ante basis.3. Past changes in interest rate yields. A=month after US 5-yr increases, B=month after US 5yr decreases.4. Same except use 90 day T-bill yield5. The 90-day T-bill minus the 12month moving average of the Tbill yield. Positive is A, negative is B.6. Last month's S&P 500 return, negative is A, positive is B.7. S&P 500 P/E minus 12-month average P/E negative is A, positive is B.8. Change in Moody's Baa-Aaa (on Federal reserve of St. Louis Website), negative is A, positive is B9. Baa-Aaa minus 12-month moving average. Positive is A, negative is B.10??? Value minus growth performance??? in previous month?Add whatever your favorite indicator is.-Cam
Historical Treasury Returns After Treasury Index Rates Rise Or FallOne Month Lag, December 1988 to April 2003