Download
1 / 59
590 likes | 660 Views
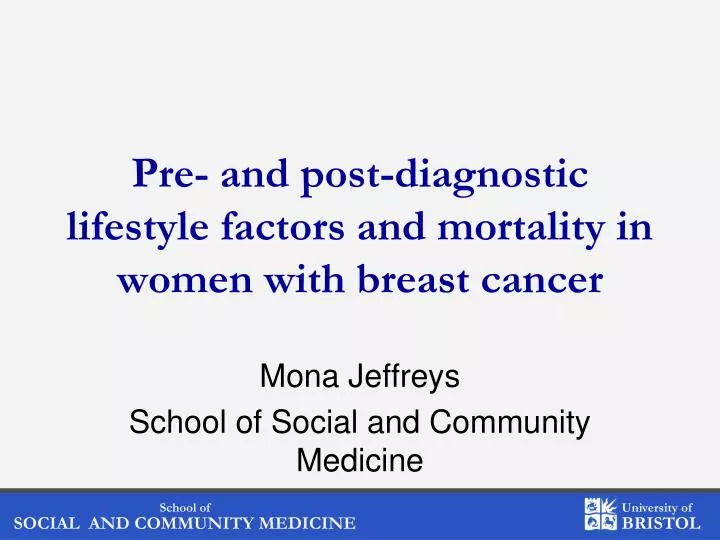
Pre- and post-diagnostic lifestyle factors and mortality in women with breast cancer . Mona Jeffreys School of Social and Community Medicine. Breast cancer. Most common cancer in women in UK Affects approximately 50,000 women in UK each year

E N D
Pre- and post-diagnostic lifestyle factors and mortality in women with breast cancer Mona Jeffreys School of Social and Community Medicine
Breast cancer • Most common cancer in women in UK • Affects approximately 50,000 women in UK each year • 85.1% of patients survive for five years or more (diagnosed 2005-2009)
Breast cancer incidence http://www.cancerresearchuk.org/cancer-info/cancerstats/types/breast/incidence
(Un)modifiable risk factors • Age • BRCA genes (family history) • Breast density • Benign breast disease • Birthweight, growth, height
Modifiable risk factors • Reproductive factors • Nulliparity / late age at first birth, early menarche, late menopause, breastfeeding • Exogenous oestrogens (OC, HRT) • Shiftwork • Diet • Saturated fat, phyto-oestrogens, fibre • Lifestyle • Body weight, alcohol, physical activity, smoking
Breast cancer survival http://www.cancerresearchuk.org/cancer-info/cancerstats/types/breast/survival/
Relative survival • Survival “adjusted for” background mortality (excess mortality “due” to cancer) • Avoids need for cause of death • Observed : expected survival ratio • Compares “observed” survival in the cancer population to “expected” survival in general population
Relative survival (cont’d) • Life-table methods (census) • May not be valid when “observed” and “expected” groups have a different underlying expected mortality • Compare ethnic groups • Cohort study with low response rate
Lifestyle determinants of survival • Good evidence of lower survival in overweight women
Obesity and all cause mortality Protani, BCRT 2010
Obesity and breast-cancer specific mortality Protani, BCRT 2010
But is it all confounding? • Women’s Intervention Nutrition Study • RCT of 2437 women, aged 43-79 • Early stage breast cancer • Intervention: dietary fat reduction • Associated weight loss (2kg difference at 3 years) • Lower recurrence in intervention group (9.8% vs 12.4%, HR 0.76 (95% CI = 0.60 to 0.98)
But is it all confounding? • Women’s Healthy Eating and Living • RCT of 3088 women, aged 18-70 • Early stage breast cancer • Intervention: High F&V, fibre and low fat • No change in body weight or energy intake • No difference in breast cancer events (HR 0.96, CI: 0.80 to 1.14) or mortality (HR 0.91; CI: 0.72 to 1.15) • Interaction with PA: reduced mortality in women with high F&V and high PA, irrespective of obesity (HR 0.56; CI: 0.31 to 0.98)
Physical activity and breast cancer outcomes Patterson 2010, http://dx.doi.org/10.1016/j.maturitas.2010.01.004
Diet and breast cancer outcomes Patterson 2010, http://dx.doi.org/10.1016/j.maturitas.2010.01.004
Diet and breast cancer outcomes (cont’d) Patterson 2010, http://dx.doi.org/10.1016/j.maturitas.2010.01.004
New Zealand Breast Cancer Study • Nationwide multi-ethnic, age- and ethnicity-matched population-based case-control study • Over-sampling of Māori and Pacific women
Methods • Cases identified from Cancer Registry • April 2006 to April 2007 • Māori and Pacific cases to April 2008 • Controls from Electoral Roll • General • Māori • Additional methods for Pacific controls • GP and community-based
Response rates (cases) • 1,799 cases • 302 (81%) Māori, • 70 (46%) Pacific, • 1,427 (78%) non-Māori /non-Pacific
Exposures • BMI and WHR • Smoking • Alcohol • Physical activity • Diet • Servings of F&V, meat (red/white), fish, milk, cream, cheese
Timing of exposure • Lifetime • “In the last year, on average...”
Ascertainment of outcome • Linked to death register • Covers all of New Zealand • Requires ethical approval • Censored at 28/02/2009 • Not valid for Pacific women • “Going home to die” • Informed of date of death but not cause • All cause mortality
Statistical methods • Kaplan Meier curves • Log rank tests • Cox regression • Followed from time of diagnosis to dead / censoring • Adjusted for age at diagnosis, menopausal status, interview method, extent of disease at diagnosis (stage)
Follow-up by ethnicity Log rank test P=0.56
Effect of BMI on survival Log rank test P=0.21
Effect of BMI on survival * Adjusted for age, menopausal status, type of interview, ethnicity and extent of disease
Effect of WHR on survival Log rank test P=0.085
Effect of WHR on survival * Adjusted for age, menopausal status, type of interview, ethnicity and extent of disease
Effect of alcohol on survival Newcomb, JCO 2013
Effect of alcohol on survival Newcomb, JCO 2013
Measurement of alcohol • How often did you have a drink containing alcohol? (frequency) • How many drinks containing alcohol did you have on a typical day when you are drinking? (amount)
Alcohol frequency and amount Nil, slight, moderate, heavy Used “slight” as the reference group
Effect of alcohol on survival Log rank test P=0.14
Effect of alcohol on survival: overall * Adjusted for age, menopausal status, type of interview, ethnicity and extent of disease
Effect of alcohol on survival: frequency Merged categories 2-3 per week and 4+ per week * Adjusted for age, menopausal status, type of interview, ethnicity and extent of disease ** Also adjusted for alcohol amount
Effect of alcohol on survival: amount Merged categories 7-9 and 10+ drinks per day * Adjusted for age, menopausal status, type of interview, ethnicity and extent of disease ** Also adjusted for alcohol frequency
Smoking • Have you ever smoked, now or in the past? • Are you a current smoker? • Categorised into never, current, ex-smokers
Effect of smoking on survival Log rank test P=0.66
Effect of smoking on survival * Adjusted for age, menopausal status, type of interview, ethnicity and extent of disease
Physical activity • Measured using Godin questionnaire • Frequency of mild, moderate and strenuous • Analysed in quartiles • Lowest quartile designated as “sedentary”
Effect of physical activity on survival Log rank test P=0.146
Effect of physical activity on survival * Adjusted for age, menopausal status, type of interview, ethnicity and extent of disease
Fruit and vegetable intake • How many servings of vegetables (excluding potatoes) did you usually eat each week? • How many servings of fruit did you usually eat each week?
Effect offruit and vegetable intake on survival * Adjusted for age, menopausal status, type of interview, ethnicity and extent of disease
Summary • Suggestion of poorer survival in women who were • Had lower BMI, but higher WHR • Never and heavy alcohol drinkers • Sedentary • No clear relationship with • F&V intake • Smoking
Other dietary measures • No clear relationship with intake of • Milk • Cream • Cheese • Meat (red/white) • Fish