Download
1 / 26
270 likes | 288 Views
Governments are relying on old solutions to fix the global economy. This article explores the need for a different approach using data science and new economic indicators. It discusses the challenges in making economic policy without data and presents examples of how data analysis can be used to understand clusters, emerging sectors, skills needs, and more. The article also emphasizes the importance of open data, better analysis of social and unstructured data, and the rise of the "datavores".

E N D
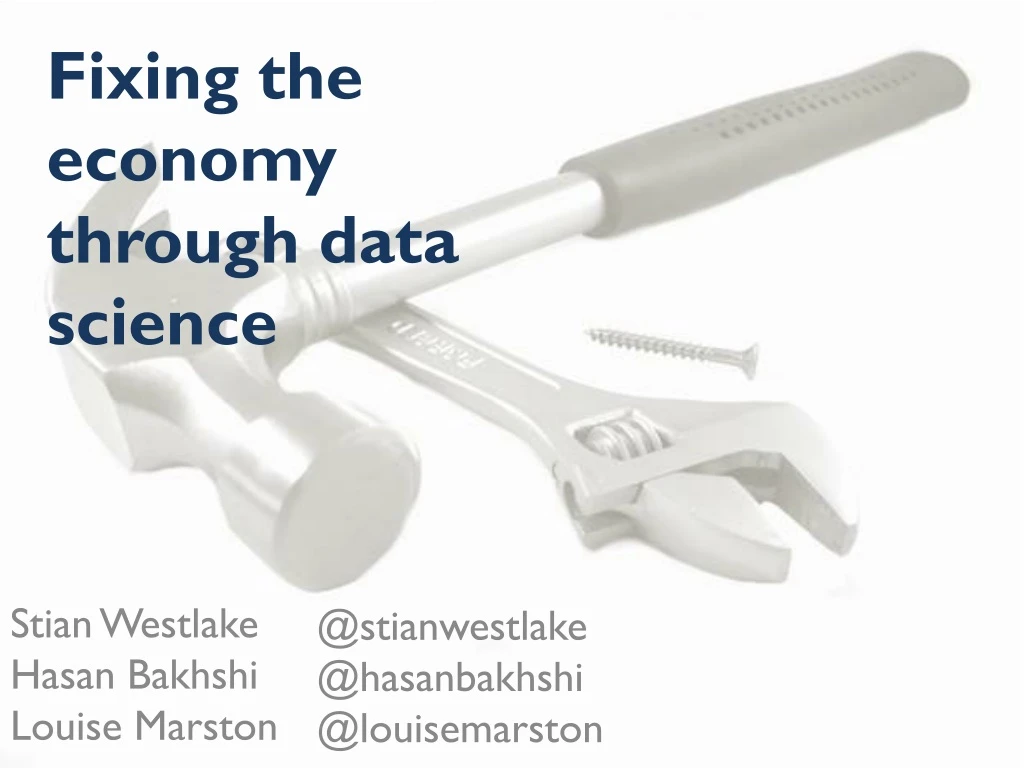
Fixing the economy through data science @stianwestlake @hasanbakhshi @louisemarston Stian Westlake HasanBakhshi Louise Marston
The global economy is still in trouble Images: The Telegraph
Governments are mostly relying on the old solutions Top-down economic policy “Technology? Hedge funds? Housing? It’s all growth as far as we’re concerned.” Image: Wikimedia/LSE
Local growth and clusters But there’s a growing recognition that we need a different approach to growth High-growth companies – the “Vital six per cent” 21st century skills – e.g. coding New technologies
Traditional economic indicators New economic indicators However, it’s hard to make economic policy without data National output figures (GDP) Inflation Companies’ financial accounts Standard industry classification codes ? Cost: £50-£100m/yr Image: The Day Today
A case in point: tell me about the UK video games industry... Image: Rockstar
SIC 90.03 Artistic creation • SIC 62.02 Computer consultancy • SIC 82.99 Other business support activities • SIC 62.09 Other information technology and computer service activities • SIC 58.21 Publishing of computer games • SIC 58.29 Other software publishing • SIC 62.01/1 Ready-made interactive leisure and entertainment software development • SIC 32.40/9 Manufacture of games and toys not elsewhere classified SIC 10.42: Manufacture of margarine and similar edible fats Games companies vs a tub of lard Image: Wikimedia Image: Rockstar
Paperwork for entrepreneurs • 10% of companies register as “Other” Image: Project Gutenberg
A lot of un-linked and unsatisfactory data • Things we’d like to know more about • Links between companies • Financial accounts of companies • Locations of companies • Registered intellectual property • Links with universities • Government grants • Skills needs Image: The Guardian
A quiet data revolution is underway • More open data • Better analysis of social and unstructured data • More linking of data sets • Administrative Data Research Network Image: The Guardian
Some examples of what can be done Analysing clusters Identifying emerging sectors Looking at links and networks within industries Understanding skills needs rapidly
Cambridge Cluster Map /Tech City Map The first generation: The Cambridge Cluster Map
Growth Intelligence/NIESR digital economy map Where is the UK’s digital economy? Businesses classified based on online information and links, not SIC codes Nathan, M. and Rosso, A. (NIESR) with Gatten, T., Majmudar, P. and Mitchell, A. (Growth Intelligence). (2013) ‘Measuring the UK’s Digital Economy with Big Data’
University of Manchester/Georgia Tech: identifying green tech firms Work by Sanjay Arora, Jan Youtie, Yin Lie – Georgia Institute of Technology – US Green Goods Companies: What can we learn about their growth from web data? Working with Philip Shapira, Abdullah Gok, EvgenyKlochikin - University of Manchester
How can you build networks in emerging sectors? 1. Attendees and funders want to understand the impact of events 2. Event organisers want to demonstrate impact of events The question of additionality: What would have happened without the event? 3. Social media data can help
1736 new Twitter follow connections created after LeWeb’12 London 15% ↑ in the total number of follow connections between attendees 9% ↑ intotal number of follow connections involving attendees
Undertaking text analysis of tweets between participants who connected at LeWeb'12 London
Real-time skills needs dashboard Ongoing Nesta funded project by Michael Mandel and Judith Scherer, South Mountain Economics
Using Big Data to map Big Data skills PrasannaTambe – Big Data Investment, Skills and Firm Value Reference: Tambe, P. (2013) ‘Big Data Investment, Skills and Firm Value’, forthcoming in Management Science. Accessed at: http://papers.ssrn.com/sol3/papers.cfm?abstract_id=2294077
Using Big Data to map Big Data skills Tambe (forthcoming) uses data from LinkedIn profiles to measure Big Data clustering, and spillovers from firm investments in Big Data skills.
What’s next? Linking together much more government data (IP, research, procurement, grants) More and better classifications/folksonomies More open data from governments and businesses (broadband speeds? cellular coverage?) Better analysis of social media and other online data sources (job ads, media, links)
Everyone is talking about data Web 2.0 Cloud computing Big Data Source: Google Trends …but the discussion is remarkably data-free
Understanding the “datavores” 1. Rise of the Datavores (Nov 2012) 2. Growth of the Datavores (forthcoming) 3. Skills of the Datavores (2014) … We create data about use of data in UK businesses => 18% of datavores vs 43% of dataphobes We estimate the links between data use and productivity, and identify synergies between data, employee empowerment & process innovation We will measure skills and knowledge of productive data talent, and identify good practices to manage & organise it
What next? • Questions? • How would economic policy look different if this all happens? • We’re looking for new partners with interesting approaches, datasets or puzzles. hasan.bakhshi@nesta.org.uk louise.marston@nesta.org.uk stian.westlake@nesta.org.uk @hasanbakhshi @louisemarston @stianwestlake


![Better Data, Better Science! [ Better Science through Better Data Management ]](https://cdn3.slideserve.com/6850091/better-data-better-science-better-science-through-better-data-management-dt.jpg)