Planning for Continuous School Improvement
210 likes | 425 Views
This professional development service focuses on utilizing multiple data measures to improve school outcomes. Explore HISD SIP process, demographic trends, stakeholder perceptions, student learning assessment, and school processes. Learn to develop SMART goals for continuous improvement.

Planning for Continuous School Improvement
E N D
Presentation Transcript
Planning for Continuous School Improvement Professional Development Services Curriculum, Instruction, and Assessment
Outcomes • To understand the importance of utilizing multiple measures of data. • To understand the systematic process for continuous school improvement planning. • To understand the HISD SIP process and requirements.
Pre-Conditions for School Improvement • Instructional Coherence • Shared Vision for School Improvement • Data Driven Decision Making
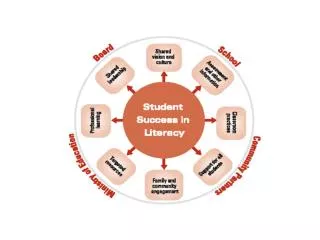
Multiple Measures of Data • Demographics • Perceptions • Student Learning • School Processes
Demographics Because trends have a clear direction, instead of causing turbulence, they actually help reduce it because they have a significant amount of predictability. Joel Barker
Demographics • Schools should begin the planning process by setting the context • What we believe turns into expectations and then action • Longitudinal trends are important for planning • Implications for professional learning and leadership
Perceptions • Perceptions are important because they are someone’s reality. • Informs behavior of the staff, students, and parents • For table conversation--What are some of the perceptions we can gain regarding students? Staff? Parents? • Staff values and perceptions impact behavior • Perceptions have an implication for planning
Student LearningWhy is it Important? • Measures student group proficiency • Assess individual or group achievement • Assess added-value progress • Guide curriculum development or revision • Improve instruction • Understand which programs are getting the results we want • Accountability • PLC Key Questions • Formative assessments
School Processes Improvement is not achieved by focusing on results, but by focusing on improving the systems that create the results. National Leadership Network
School Processes • Most difficult to measure • Evaluate impact of curriculum, instruction, assessment, and interventions • What processes will create the results we want?
Evaluation of School Processes • Review the continuum and determine where your school is in each area. • Pair/share- Discuss your reflections with a partner.
Intersection of Data– Moving from Random Acts of Improvement to Focused Acts of Improvement • What processes or programs work best for different groups of students measured by student learning results? • What impact do demographic factors and student attitudes about the learning environment have on student learning? • Are all groups of students represented in the different programs and processes offered by the school?
Table Activity • Categorize each of the activities as Input, Process, or Outcome Input Data elements that describe the “givens” that are usually beyond our immediate control.
Table Activity (con’t) Process Elements that describe the actions learning organizations plan for and implement to get the outcomes they are striving to achieve, given the input. Outcome The data elements that describe the results of a learning organization’s processes.
The Process • Review of flow chart questions • HISD planning process • HISD template
Resources • Victoria Bernhardt, Using Data to Improve Student Learning • DuFour, DuFour, Eaker, and Many, Learning by Doing • List of resources on handout aligned to district initiatives and framework
Next Steps • Gather and analyze demographic data to extent possible • Discuss mission, vision, and values • If possible, determine perceptions of stakeholders • Analyze student achievement data • Develop first draft of 3 SMART goals