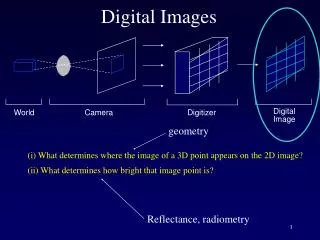
Download
1 / 39
400 likes | 429 Views
Explore the application of digital image analysis in environmental research for classroom education. Learn how to analyze air quality, water quality, and arsenic contamination using innovative STEM DIGITAL technology.

E N D
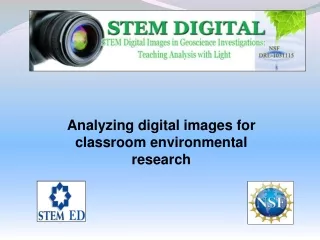
Analyzing digital images for classroom environmental research
The Big Idea • Digital cameras and computers are widely available for students and teachers. However, they are mainly used for documentation: creating PPT presentations, handouts, posters, etc. • STEM DIGITAL shows how digital image analysis can be applied to environmental research in STEM courses • Application to studies of air quality, water quality, arsenic contamination • Other examples from climate change, diffusion …
People Faculty • Mort Sternheim, STEM Ed, PI • Steve Schneider, Astronomy, Co-PI (air quality) • Julian Tyson, Chemistry (arsenic) • David Reckhow, Environmental Engineering (water quality) Grad students • Deborah Carlisle, Science Ed (air quality) • Karen Tallman, Science Ed (arsenic) • Tiffany Berg, Chemistry (arsenic) • Amy Biddle, Microbiology (water quality)
People, cont. Teachers • Rob Snyder, HS science, retired • Jennifer Welborn, MS science, Amherst Regional • Holly Hargraves, MS English, retired Software • John Pickle, Concord Academy, ADI author • Dan Gullage, STEM Ed, software upgrades Project Manager • Marie Silver Evaluators • SageFox Associates
Analyzing Digital Images Software • Software package developed by John Pickle, Concord Academy (formerly at the Museum of Science, Boston) • Free, student friendly, available for Windows and Mac • Color and digital image basics • Spatial, spectral, temporal analysis tools • Downloads: www.lawrencehallofscience.org/gss/rev/ip • Upgraded, coming soon: www.umassk12.net/digital
Program components • Upgrade Analyzing Digital Images software • 5-day summer institutes, 2011 an 2012 • Middle and high school STEM teachers • Develop arsenic, air quality, water quality and other protocols • Stipends, materials, housing, meals • Grad credits or Professional Development Points • Academic year follow-up • Online course, summer 2013
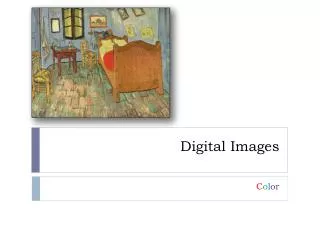
Presented by Rob Snyder Color Basics
Three primary colors of light combine to form white light on a screen or wall An ADI graph reveals equal red, green, and blue components of white light Inexpensive red, green, and blue floodlights demonstrate the additive mixing of colors of light
3 primary pigments combine to produce black An ADI graph reveals the absence of red, green, and blue components of black Mixing cyan, magenta, and yellow pigments demonstrates subtraction of colors
Studying Ozone and Air Quality Deborah Carlisle Steve Schneider
Measuring Ground-level Ozone O3 levels above 120 ppb are considered unhealthy. They can be generated by some electrical equipment or from photochemical reactions with smog: VOC’s + NOX + sunlight O3 Motor vehicles are the single largest contributor to ground-level ozone. In this project we are adapting the relatively easy-to-make Schoenbein papers for classroom use, developing a calibrated digital measurement scale.
Schoenbein Papers Ozone was discovered by C.F. Schoenbein in 1839. He developed an ozone-sensitive test paper that was widely used historically, and more recently in classrooms. The standard protocol for using the papers calls for an 8-hour exposure to the air out of direct sunlight. Various studies have shown a dependence on humidity, and there are a variety of recommendations for moistening the strips prior to exposure. Control low O3 high O3 exposure exposure • Making Schoenbein Papers: • Prepare Starch Solution, heating until it gels. • Add ¼ tsp of potassium iodide, KI, and let cool. • Apply the starch/KI paste to filter paper, one side at a time. • Let papers dry in a darkened area without sunlight exposure. • Cut into strips about 1” wide and 3” long. • Store in double plastic zip lock bags out of direct light.
How do Ozone Test Strips Work? Ozone is a strong oxidizer. It rapidly reacts with the iodide ion, I- in the KI salt applied to the filter paper: KI + H2O + O3 I2 + O2 + K+ I2 + I- + starch I3- + starch (turns blue) Cntrl 80ppb 130ppb
Facilitating Classroom Use: 1. We find that strips can be exposed dry, stored, and then dipped into water just before photographing. The exposed strips react with the water to produce a more uniform and consistent color that appears less dependent on humidity. 2. With digital monitoring devices, we are developing a digital color scale that can be used to test ozone levels after exposures of only an hour. 3. We are also testing and developing digital color calibration for commercial ozone-testing papers, although their cost per test may be prohibitive for many schools.
Coming later … • Carbon dioxide measurements as in indicator of indoor air quality • Solar aureole as a measure of atmospheric particulates
Arsenic in food • We are using digital imaging to develop a more reliable measurement tool for comparing a test strip and color standards for arsenic concentrations. • We are developing lessons whereby students can explore food samples, such as rice, for arsenic concentrations.
How Arsenic Gets Into Rice Karen Tallman Tiffany Berg Julian Tyson
Good intentions gone awry. Bangladesh villagers dig a tubewell. Encouraged as a solution to pathogenic contamination of surface waters, such wells have resulted in exposures of millions to arsenic, leading to the need for alternative water sources.
Arsenate + zinc + acid produces AsH3. Soluble in water 780 mg/L, but dissolved salts and H2 evolution transfer AsH3 into head space. AsH3 reacts with mercuric bromide impregnated test strip. Yellow-brown color produced after set time is compared with preprinted chart.
Recent analysis of arsenic in Japanese rice White (unpolished) Glutinous 0.54 mg kg-1 White (polished) Glutinous 0.29 mg kg-1 White (polished) Jasmine 0.10 mg kg-1 Violet-black (unpolished) Glutinous 0.42 mg kg-1 FAO/WHO As limit: 0.015 mg/day (70 kg person)
Sensitivity issues. Our approach: increase the time that the test is run for. Here are the 30 min data.
Sensitivity issues. Our approach: increase the time that the test is run (for 24 h Note increase in slope).
Using Digital Imaging to Assess Water Quality Amy Biddle, David Reckhow Natural organic matter … is removed by water leaches into water… treatment measures Filtration Coagulation Leaf Litter Soil Runoff Human Sources Animal Sources http://www.floridasbestwater.com
Plant material is added to water sample Water treatment strategies are applied • Natural organic matter leaches • over time Digital images used to track leaching process Digital images used to track treatment progress Experimental Overview Treatment Options: Alum only Alum + Calcium carbonate Activated charcoal Filtration
Data Analysis Images of light through water Spectral images Analyzing Digital Images Software How do patterns of RGB values change? Correlation of RGB values to wavelengths.
Massachusetts Science and • Engineering/Technology Curriculum • Framework • Biology: Earth and Space Science: • Ecology Earth Processes and Cycles • Inquiry: • Student designed experiments exploring… • Factors influencing the leaching process: • types of leaves, conditions, water properties • Factors influencing the treatment process: • comparison of different strategies
Remote sensing images Measure seasonal increase and decrease in Arctic, Antarctic ice Measure changes over a period of years Look at land use Vegetative health ….
Measuring Arctic Ice • Measure seasonal changes in area • Measure changes in area over the years Mort Sternheim
Measuring albedo • Melting Arctic ice or snow exposes water or tundra, decreasing the reflection of sunlight or the albedo • This is one reason climate change is greatest in Polar Regions Snow Snow reflected intensity ~ 85 units Muddy turf ~15 units Muddyturf
Aiptasia pallida as a Model Organism for Effect of Environmental Stressors on Coral Bleaching • Amherst Regional Middle School NSF STEMRAYS after-school club student authentic research project
Aiptasia pallida is a sea anemone which houses symbiotic dinoflagellates. The brown color of the tentacles is due to the presence of these organisms. • Coral also contain symbiotic organisms. Coral bleaching occurs when the coral is stressed and releases these organisms. Coral are difficult to culture in a lab. • Aiptasia pallida is easy to culture and can test the effects of environmental stressors (change in temperature, light, pH) on the release of the symbiotic organisms. • A student interested in coral bleaching is researching environmental effects on Aiptasia. She photographs the organisms before and after exposure to a stressor.
Three Aiptasia individuals are shown. The off-white structures are the bases which attach to a substrate. The brown structures are the tentacles which house the symbiotic dinoflagellates.
Using the ADI software, a line is drawn on one individual. Since Aiptasia are fixed in place, the same line can be drawn in the future for comparison.
The Diffusion of CO2 Through Gelatin as a Model for Diffusion of CO2 Through a Cell Over Time • Diffusion is one of the ways materials move into and out of cells. Gelatin has a consistency similar to a cellular matrix and can be used to show the movement of materials. • A disk of gelatin is prepared with bromothymol blue, an acid- base indicator. Yellow indicates an acid, blue indicates a base. The disk is placed in a Petri dish. Non-carbonated water is poured into the space surrounding this control disk. Another disk has carbonated water. • A time series of photographs and the corresponding ADI graphs reveals the diffusion of CO2 through the gelatin.
Contacts • Mort Sternheim, PI, mort@umassk12.net • Steve Schneider, Co-PI, schneider@astro.umass.edu • Marie Silver, Project Manager, msilver@umass12.net • Web site: www.umassk12.net/digital