Download

1 / 18
180 likes | 286 Views
This report by Gokarna Awasthi, Chief of the Business Bureau at Kantipur Daily, outlines Nepal’s budgetary process and economic structure for the current fiscal year. Highlighting a total budget of NPR 517 billion, with major allocations in capital expenditure and a revenue target of NPR 354 billion, it discusses economic indicators such as a GDP growth rate of 3.6%, inflation at 10%, and unemployment at 4%. The challenges facing various sectors, including agriculture, trade, and employment, are addressed, along with objectives aimed at improving the livelihoods of the people and fostering political stability.

E N D
Budgetary process Nepal Gokarna Awasthi Business Bureau Chief, Kantipur Daily
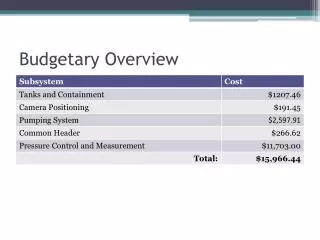
Structure of the Economy Total GDP- Around 1700 billion Agriculuture- 35% Services- 50% Manufacturing- 7% Others- 8%
Economic Highlights • GDP Growth Rate- 3.6 % • Inflation- 10 % • Unemployment rate- 4% • Investment- Around 30% of GDP • Consumption- 90% of GDP • Debt- 14 thousand per person (266b f d)
Budget • Income and expenditure framework of the government in a particular fiscal year. • Eco-political document of the ruling party
BudgetCurrent fiscal year Total Budget- 517 billion Capital Expenditure - 85 bn. Re- Current- 353 bn. Financing- 78 bn Revenue Target- 354 bn. Foreign Grant- 69 bn. Deficit- 87 bn.
Budget implementation status • 2061/62 2062/63 2063/64 2064/65 2065/66 • Tar. Ach. Tar. Ach Tar Ach Tar. Ach. Tar. Ach. • Growth 4.5 2 4. 2.3 5 2.5 5 5.56 7 3.9 • Inflation 4 4.3 3.9 8 5 6.6 6.4 7.7 7.5 13 • Dev. E. 31b 25b 36b 29b 45b 39b 55b 53b 91b 60b
Budget implementation status • 2066/67 2067/68 2068/69 2069/70 • Tar. Ach. Tar. Ach Tar Ach Tar. Ach. • Growth 5.5 3.5 5 3.5 5.5 4.6 5.5 3.6 • Inflation 7.5 9.6 7.5 9.6 7 8.3 7 9.9 • Dev. E. 106b 80b 129b 108b 72b 60b 51b 45b
International Trade • Total export-77 billion (FY 2012/2013) • Total export- 52 bn. (First 7 months) • Total import - 556 billion (FY 2012/2013) • Total Import- 392 bn. ( First 7 months) • Trade Deficit- 479 bn. (FY 2012/2013) • Trade Deficit – 339 bn. ( First 7 months) • India alone comprises 63 % of total trade
Industrial Sector • Growth 1.5% • Insecurity • Labor Dispute • Load Shedding • Strikes & Bandas • Lack of Special economic Zone • Trading Culture
Foreign Employment • Foreign Employment • Around 3 million Nepalese working abroad expect India • Around 1400 youths leave Nepal every day for employment • Nepal received Rs. 434 billion Remittance last year • 90 percent works in Malaysia, UAE, Quatar and Saudi
Challenges • Lack of Skilled Manpower • Workers r working in a vulnerable working environment. • Passive Economic Diplomacy. • Low salary.
Tourism • Around 800 thousands tourist arrival- 2012 • Significat growth in 2010 • 2011 visit Nepal year • Lack of connectivity –NAC • Strikes and bandas • Lack of Skilled Manpower
Agriculture • Around 70 percent Nepalese engaged • 32 percent of GDp • Livelihood production process • Lack of Market • Lack of transportation system • Irrigation -60 % projects seasonal • Non tariff barriers in export • Technology constraints • 450 thousand ton food deficit (Last year)
Dual Economy • Rural Economy • Agriculture- Livelihood • Agro Based Industry- Small Scale, Lack of technology and Market • Tourism- Government’s Slogan • Poverty- Extreme • NGO’s influence- Non effective • Politically aware
Dual… • Urban Economy • Service Sector • Agency Business • Financial intermediaries • Real Estate • Share Market • Tourism • Less value added economic activities • Higher employment then rural areas • Vulnerable informal sector for employee
Macro-Economic Challenges • Poverty- 23 percent people below poverty line • Lower Growth- Average 3 to 4 Percent • Unemployment- 76 lacs under employed • Lower Savings- Around 90 percent of the incomes spends on consumption • High Inflation- Around10 % Previous year highest in 17 Years
Objectives of the Budget • Happiness of the People • Employment Creation • Increase Investment • Conducive Environment • Security • Strong Government • Political Stability • Political consensus • National Interest