Download
1 / 1
20 likes | 186 Views
Airborne and in situ validation of satellite altimetry measurements over sea ice. Ice Drift. Ice Drift. GreenArc Ice Camp. Outbound Swath. Outbound Swath. Inbound Swath. Inbound Swath. Runway. Camp. Survey Line Markers. Canada Basin Study Area.

E N D
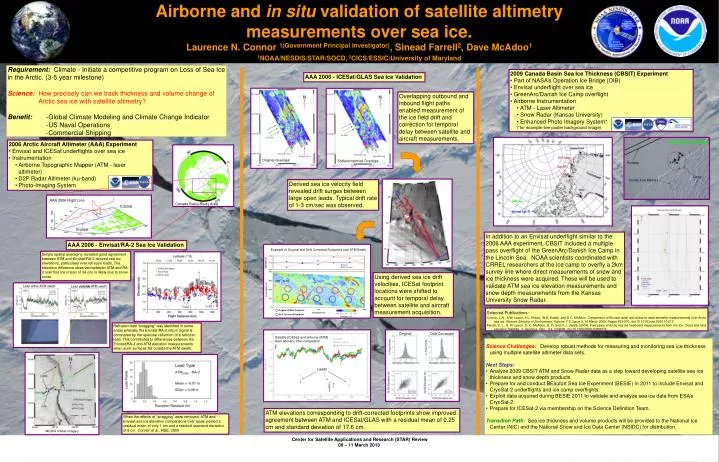
Airborne and in situ validation of satellite altimetry measurements over sea ice. Ice Drift Ice Drift GreenArc Ice Camp Outbound Swath Outbound Swath Inbound Swath Inbound Swath Runway Camp Survey Line Markers Canada Basin Study Area Example of Original and Drift Corrected Footprints over ATM Swath Lead within ATM swath Lead outside ATM swath Original ICESat Footprint Drift Corrected Footprint Original Drift Corrected Leads Laurence N. Connor 1(Government Principal Investigator), Sinead Farrell2, Dave McAdoo1 1NOAA/NESDIS/STAR/SOCD, 2CICS/ESSIC/University of Maryland Requirement: Climate - Initiate a competitive program on Loss of Sea Ice in the Arctic. (3-5 year milestone) Science:How precisely can we track thickness and volume change of Arctic sea ice with satellite altimetry? Benefit: -Global Climate Modeling and Climate Change Indicator -US Naval Operations -Commercial Shipping • 2009 Canada Basin Sea Ice Thickness (CBSIT) Experiment • Part of NASA’s Operation Ice Bridge (OIB) • Envisat underflight over sea ice • GreenArc/Danish Ice Camp overflight • Airborne Instrumentation • ATM - Laser Altimeter • Snow Radar (Kansas University) • Enhanced Photo Imagery System* • (*for example see poster background image) AAA 2006 - ICESat/GLAS Sea Ice Validation Overlapping outbound and inbound flight paths enabled measurement of the ice field drift and correction for temporal delay between satellite and aircraft measurements. • 2006 Arctic Aircraft Altimeter (AAA) Experiment • Envisat and ICESat underflights over sea ice • Instrumentation • Airborne Topographic Mapper (ATM - laser altimeter) • D2P Radar Altimeter (ku-band) • Photo-Imaging System Original Overlaps Shifted/matched Overlaps Derived sea ice velocity field revealed drift surges between large open leads. Typical drift rate of 1-3 cm/sec was observed. AAA 2006 Flight Line ICESat Envisat In addition to an Envisat underflight similar to the 2006 AAA experiment, CBSIT included a multiple pass overflight of the GreenArc/Danish Ice Camp in the Lincoln Sea. NOAA scientists coordinated with CRREL researchers at the ice camp to overfly a 2km survey line where direct measurements of snow and ice thickness were acquired. These will be used to validate ATM sea ice elevation measurements and snow depth measurements from the Kansas University Snow Radar. AAA 2006 - Envisat/RA-2 Sea Ice Validation Simple spatial averaging revealed good agreement between ATM and Envisat/RA-2 derived sea ice elevations, particularly over refrozen leads. The elevation difference observed between ATM and RA-2 over floe ice (mean of 34 cm) is likely due to snow cover. Using derived sea ice drift velocities, ICESat footprint locations were shifted to account for temporal delay between satellite and aircraft measurement acquisition. ATM - GLAS Selected Publications: Connor, L.N., S.W. Laxon, A.L. Ridout, W.B. Krabill, and D.C. McAdoo. Comparison of Envisat radar and airborne laser altimeter measurements over Arctic sea ice. Remote Sensing of Environment, Volume 113, Issue 3, 16 March 2009, Pages 563-570, doi:10.1016/j.rse.2008.10.015 Farrell, S. L., S. W. Laxon, D. C. McAdoo, D. Yi, and H. J. Zwally (2009), Five years of Arctic sea ice freeboard measurements from the Ice, Cloud and land elevation Satellite, J. Geophys. Res., 114, C04008, doi:10.1029/2008JC005074. Refrozen lead “snagging” was identified in some areas whereby the Envisat/RA-2 return signal is dominated by the specular reflection of a refrozen lead. This contributed to differences between the Envisat/RA-2 and ATM elevation measurements when such surfaces fell outside the ATM swath. Satellite (ICESat) and airborne (ATM) laser altimetry inter-comparison I • Science Challenges: Develop robust methods for measuring and monitoring sea ice thickness using multiple satellite altimeter data sets. • Next Steps: • Analyze 2009 CBSIT ATM and Snow Radar data as a step toward developing satellite sea ice thickness and snow depth products. • Prepare for and conduct BEaufort Sea Ice Experiment (BESIE) in 2011 to include Envisat and CryoSat-2 underflights and ice camp overflights. • Exploit data acquired during BESIE 2011 to validate and analyze sea ice data from ESA’s CryoSat-2. • Prepare for ICESat-2 via membership on the Science Definition Team. • Transition Path: Sea ice thickness and volume products will be provided to the National Ice Center (NIC) and the National Snow and Ice Data Center (NSIDC) for distribution. ATM elevations corresponding to drift-corrected footprints show improved agreement between ATM and ICESat/GLAS with a residual mean of 0.25 cm and standard deviation of 17.6 cm. When the effects of “snagging” were removed, ATM and Envisat sea ice elevation comparisons over leads yielded a residual mean of only 1 cm and a residual standard deviation of 8 cm. Connor et al., RSE, 2009 MODIS Visible Imagery Center for Satellite Applications and Research (STAR) Review 09 – 11 March 2010