Microsoft excel 2002
Learn how to utilize Microsoft Excel in tracking and calculating student grades through this step-by-step project. Enhance your spreadsheet skills by creating formulas, adding graphics, and applying formatting attributes.


Microsoft excel 2002
E N D
Presentation Transcript
Mr. Verlin South Philadelphia High School May 4-6, 2011 Microsoft excel 2002
Preliminaries • Pre-class (20 classwork points): pretend that you’re a classroom teacher. One of a teacher’s responsibilities is to manage a grade book to track student grades. In your notebooks or in a Word document, make a list of things that teachers need to include in order to calculate grades.
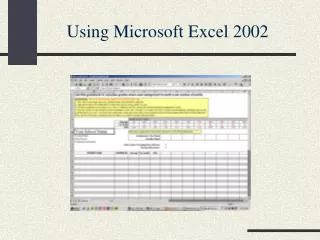
Excel Review Be able to freeze the top row of a workbook. Be able to add a graphic. Be able to add formulas to a worksheet to calculate sums over defined ranges of values (by rows and columns). Be able to copy values from one range of cells to another. Be able to draw attention to certain cells by adding borders around them. Be able to apply certain formatting attributes to ranges of cells which meet certain criteria.
Excel Project (part #1) • Introduction • Due 5/6 for 30 project points • Objective: test your proficiency in spreadsheets for numerical calculations by creating a spreadsheet to facilitate the calculation of class grades. • Requirement: calculate a class grade based on the average of the following: • Grade components • Average of 2 tests • Average of 2 lab projects • 1 final exam • Weights • Tests = 25% • Projects = 10% • Final exam = 65%
Rubric: Excel Project #1 • For a “D” (up to 18 points): • Type in the data. • Make the layout attractive and easy to read. • Include a well defined header (your name, class, current date, etc.) • For a “C” (up to 21 points): • Include all of the above. • Include a straight average for all of the components. • For an “A” (up to 30 points): • Include all of the above. • Include a weighted average for all of the components using the weights stated on the project handout. • Enabling re-calculation of the final average whenever the weights change.