Download
1 / 25
250 likes | 275 Views
This article discusses the different techniques and observatories used for detecting gamma-ray sources in astrophysics, including space-based observatories and ground-based detectors. It also covers the challenges in detecting point sources, extended sources, and transient sources, as well as the detection of active galactic nuclei and galactic diffuse emission. The article provides information on the detection methods and technologies used, as well as the limitations and advancements in the field.

E N D
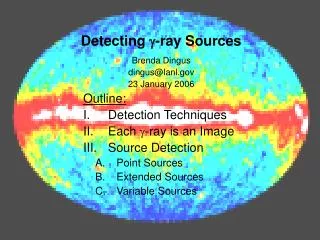
Detecting g-ray Sources Brenda Dingus dingus@lanl.gov 23 January 2006 Outline: Detection Techniques Each g-ray is an Image Source Detection Point Sources Extended Sources Variable Sources
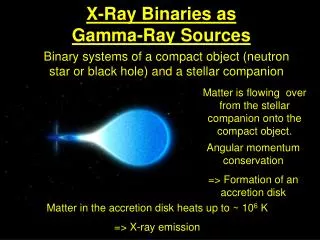
g-rays Probe Nature’s Particle Accelerators Spinning Neutron Star powering a relativistic wind HST Image of M87 (1994) Binary Neutron Star Coalescing Artist Conception of Short GRBs TeV image of Vela Jr. Supernova Remnant Black Hole producing relativistic jet of particles HESS TeV + x-ray Chandra x-ray image Massive Star Collapsing into a Black Hole SuperComputer Calculation
Low Energy Threshold EGRET/GLAST Large Aperture/High Duty Cycle Milagro, Tibet, ARGO, HAWC High Sensitivity HESS, MAGIC, CANGAROO, VERITAS Different Types of Detectors for Gamma-Ray Astrophysics Low Duty Cycle/Small Aperture Large Effective Area Excellent Background Rejection Known Source Spectra Known Source Lightcurves Survey of Galactic Plane Large Duty Cycle/Large Aperture Space-based (Small Area) “Background Free” Sky Survey > 100 MeV Transient Sources Extended Sources Large Duty Cycle/Large Aperture Moderate Area Good Background Rejection Sky Survey >~ 1 TeV Transient Sources Extended Sources
High Energy g-ray Observatories in Space • Pre Compton Observatory • SAS2 • CosB • 10-20 sources • Compton Observatory • 1991-2000 • EGRET (spark chamber) • ~300 sources • GLAST • Launch September 2007 • >5000 sources
Satellites (30 MeV to 300 GeV g-rays) Pair-Conversion Telescope anticoincidence shield conversion foil particle tracking detectors e– • calorimeter • (energy measurement) e+ • g-rays interact via pair production in dispersed foils • Cosmic-ray background (mostly protons) is rejected by anticoincidence shield AND inverted V-image of electron-positron pair • g-ray direction is determined by energy-weighted average of the electron and positron tracks • Angular Resolution is dominated by multiple scattering (a 1/Energy) at low energies and by position resolution of tracker at high energies • Energy Resolution is ~10%, but lower energies are always more probable due to source spectra which is typically dN/dE ~ K E-2
Energy Dependent Localization • The number of g-rays is small with typically < 100 per source • Use spatially unbinned likelihood analysis (infinitesimally small bins with either 0 or 1 event) • Use Energy Dependent Point Spread Function to calculate the Model in small energy intervals • Require the normalization in each energy interval to fit a power law spectrum with free parameters for the overall normalization and spectral index EGRET’s Galactic Center Source Galactic Latitude (deg) Galactic Longitude (deg) Diamonds show g-rays > 5 GeV. 95 % confidence intervals are Black Circle for Previous Analysis and Blue Area is New Analysis.
Point Source Survey Integral Flux (E>100 MeV) cm-2s-1 • Source confusion will be a problem • ~ 1 source/ 4 sq deg • Point Spread Function at 0.1 (1) GeV is 3.5 (0.4) deg • Typical (weak) source will have < 100 g-rays detected • Most sources vary with time as much as an order of magnitude • Different Spectra also help with harder (higher energy) spectra having better localization Prediction for GLAST Detections Of Active Galactic Nuclei
Time Variable Sources - GRB940217 (100sec) - PKS 1622-287 flare - 3C279 flare - Vela Pulsar - Crab Pulsar - 3EG 2020+40 (SNR Cygni?) - 3EG 1835+59 - 3C279 lowest 5 detection - 3EG 1911-2000 (AGN) - Mrk 421 - Weakest 5 EGRET source • Small # of g-rays limits minimum variability time scale • At least 5 g-rays are required to detect a source • Bayesian block statistical technique is needed to distinguish the lightcurve 100 sec 1 orbit 1 day
Galactic Diffuse Emission • g-rays are produced by interaction of cosmic rays with matter and photons in the Galaxy • Structure (e.g. molecular clouds) is comparable to the size of the g-ray point spread function • The uncertainty in the model of diffuse emission is difficult to determine, but does effect point source detection • Use maximum likelihood test with diffuse model + point source vs only diffuse model to quantify significance of point sources (need Monte Carlo to derive probability from Test Statistic) Galactic Diffuse Model & EGRET Data (Hunter et al. 1998) -180 -140 -100 -60 -20 20 60 100 140 180
Water Cherenkov Extensive Air Shower Detectors e m g 8 meters 50 meters 80 meters • Detect Particles in Extensive Air Showers from Cherenkov light created in a covered pond containing filtered water. • Reconstruct shower direction from the time different photomultiplier tubes are hit. • 1700 Hz trigger rate (>50 billion events/yr) mostly due to Extensive Air Showers created by cosmic rays • Field of view is ~2 sr and the average duty factor is nearly 100% Milagro Cross Section Schematic
Angular Reconstruction Use nsec timing from each PMT hit to fit direction of primary particle Monitor angular reconstruction with the space angle difference between reconstructions of individual events with the Even vs Odd # PMTs (delEO) delEO is ~ twice the angular resolution due to the error in each subset as well as the improvement when the # of points in the fit is doubled. Median Deven-odd = 1.0o implies Gaussian s of 0.4o for proton reconstruction Red Monte Carlo Black Data Deven-oddin degrees
Event Images in Milagro Protons Gammas Size of red dots indicate # of photoelectrons detected. Proton MC Gamma MC Data Cut at C>2.5 to Retain 50% g and 9% protons.
MARS1 (Multivariate Adaptive Regression Splines) • Predicts the values of an outcome variable given a set of independent predictor variables • Calculates probability of g vs background for all combinations of parameters • MARS Value is ln[P(signal)/P(background)] • More positive means more -like Differential Distribution Integral Distribution 1J. Friedman, “Multivariate Adaptive Regression Splines”, Annals of Statistics 19 (1991).
Weight events by Expected S:B Combining Data with Different Cuts: Weighted Analysis Milagro’s Crab Signal Hard Cuts: NFIT>=200,C>6.0 Std Cuts: NFIT>=20,C>2.5 Excess = 5410, Off = 1218288, S:B = 1:225 ehadron background =~ 0.1 Excess = 60, Off = 140, S:B = 1:2.3 ehadron background =~ 1x10⁻⁵
Point Source Search - Weighted Analysis • Optimal Bin Size for Point Sources: • If Guassian Point Spread Function, then Radius of Bin is 1.6 x s of the Gaussian Point Spread Function • If Square Bin, then chose dimensions to give same area as square bin • Milagro Opt Square Bin Size = 2.1o Vicinity of the Crab s=1.03 Cygnus Region Crab Mrk421
Variable Source Search • Search in spatial and time domain • Examine >50 time intervals from < 1 msec to 2 hrs to days, weeks, months • Shortest time intervals (< 1 sec) use starting times of the single events • Longer time intervals are oversampled by factor of two • Monte Carlo is used to access trials penalty of oversampling For this analysis, searching and oversampling worsens sensitivity by ~ factor of 2, because ~10 s result is required to give a 5 s chance probability
Extended Source Search s=1.082 The Northern Sky above 100 MeV (EGRET) Vary Bin Size from 2.1O to 5.9O (Optimal for ~5O source) As bin size increases to > 6O background estimation suffers Cygnus Region Significance: 9.1s Post-trials probability: >7s Crab Cygnus Region Milagro FOV EGRET Data Cygnus Region Crab
A Closer Look at the Galactic Plane • GP diffuse excess clearly visible from l=25O to l=90O. • Cygnus Region shows extended excess of diameter ~5O-10O. • FCygnus ~= 2x FCrab
Galactic Latitudinal Distribution Color Map does not show error bars Map is oversampled which smooths the data Make Slices in Latitude for different Longitude cuts Consider Region l = 20O-100O -2<b<2 gives 7.5s Exclude the Cygnus Region: l=20O-75O -2<b<2 gives 5.8s Galactic longitude 20-75 excludes Cygnus region Galactic longitude 20-100 includes Cygnus region s=1.42 +/- .26
Cygnus Region Morphology EGRET Diffuse Model Atomic Hydrogen radio contours • Convolve Cygnus region excess with Milagro PSF(0.75O). • Region shows resolvable structure. HEGRA detected TeV Source: TEV J2032_4130. PSF
EGRET Unidentified Sources in the Cygnus Region psf 3rd EGRET Catalog sources shown with 95% position error circle. 7 4 • F > 100 MeV/cm2sg • 3EG J2016+3657 (34.7 ± 5.7) x 10-8 2.09 • 3EG J2020+4017 (123. ± 6.7) x 10-8 2.08 • 3EG J2021+3716 (59.1 ± 6.2) x 10-8 1.86 • 3EG J2022+4317 (24.7 ± 5.2) x 10-8 2.31 • 3EG J2027+3429 (25.9 ± 4.7) x 10-8 2.28 • 3EG J2033+4118 (73.0 ± 6.7) x 10-8 1.96 • 3EG J2035+4441 (29.2 ± 5.5) x 10-8 2.08 6 2 3 1 5 Flux of maximum point: 500mCrab (May be extended)
EGRET Data >1 GeV Weight EGRET >1 GeV g-rays by EGRET’s energy dependent psf 7 4 6 2 3 1 5
Slice of EGRET Data 1st point source 2nd point source Galactic Diffuse • Cut on the Dec. band around Milagro’s bright spot • 2 point sources or 1 extended source? • EGRET catalog sources were fit as point sources ONLY • How close together can GLAST resolve 2 sources of this signal strength? Max error bar
Summary of the Statistical Issues • Event Reconstruction requires advanced pattern recognition and analysis techniques • Background estimation and uncertainty effects detection significance • Signal events should be weighted by probability of being signal and angular resolution • Effective area of the detector is continuously changing and may vary over the size of the point spread function • Chance probabilities are effected by oversampling and must be simulated by Monte Carlo