Download
1 / 51
520 likes | 547 Views
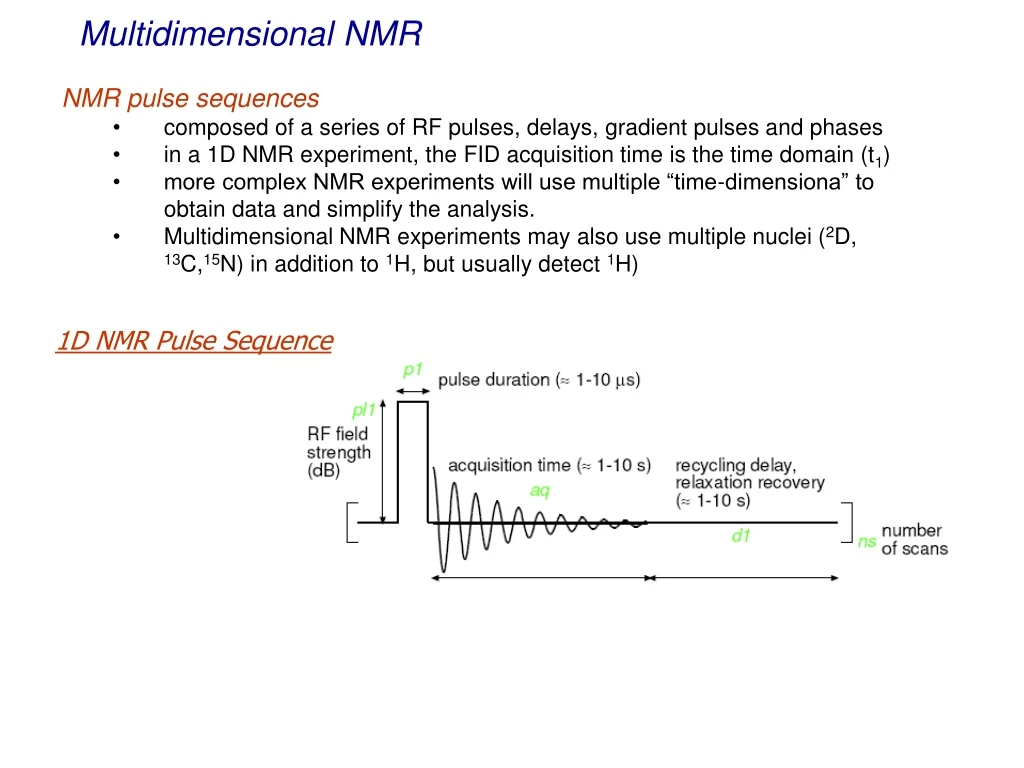
Multidimensional NMR. NMR pulse sequences composed of a series of RF pulses, delays, gradient pulses and phases in a 1D NMR experiment, the FID acquisition time is the time domain (t 1 ) more complex NMR experiments will use multiple “time-dimensiona” to

E N D
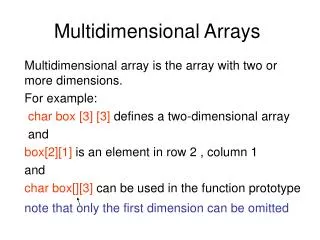
Multidimensional NMR • NMR pulse sequences • composed of a series of RF pulses, delays, gradient pulses and phases • in a 1D NMR experiment, the FID acquisition time is the time domain (t1) • more complex NMR experiments will use multiple “time-dimensiona” to • obtain data and simplify the analysis. • Multidimensional NMR experiments may also use multiple nuclei (2D, • 13C,15N) in addition to 1H, but usually detect 1H) 1D NMR Pulse Sequence
Multidimensional NMR • Creating Multiple Dimensions in NMR • collect a series of FIDS incremented by a second time domain (t1) • evolution of a second chemical shift or coupling constant occurs during this time period • the normal acquisition time is t2. • Fourier transformation occurs for both t1 and t2, creating a two-dimensional (2D) NMR spectra Relative appearance of each NMR spectra will be modulated by the t1 delay
f(t) time, t • Multidimensional NMR • Creating Multiple Dimensions in NMR • collect a series of peaks incremented by a second time domain (t1) • Peak intensity (phase) will modulate at a frequency corresponding to the correlated chemical shift and/or coupling constant increasing t1
Multidimensional NMR • Creating Multiple Dimensions in NMR • Number of FIDs or Spectra collected as a function of t1will determine: • number of data points in t1 • resolution of the t1 dimension • experiment time • Number of scans x acquisition time x number of t1 points • 1D NMR ~few mins. 2D ~few hours 3D ~ few days • t1 increment will determine the sweep-width in t1 • usually a factor of two increasing t1 FT typically significantly lower digital resolution in t1
Fourier Transform t2 obtain series of NMR spectra modulated by t1 Collections of FIDs with t1 modulations Looking down t1axis, each point has characteristics of time domain FID • Multidimensional NMR • First Step is to Fourier Transform Each Individual FID collected • Data processing in t2 proceeds the same as processing a standard 1D spectrum • Needs to be phased • Baseline correction or solvent subtraction if necessary • Choice of zero-filling or apodization function • Matrix of spectra needs to be “transposed” before processing t1 dimension
Multidimensional NMR • Creating Multiple Dimensions in NMR • Spectra is now processed along t1 dimension • Similar to t2 processing • Diagonal peaks are normal 1D spectrum • Off-diagonal or cross-peaks indicate correlation between diagonal peaks • Processed spectra is actually three-dimensional, where peaks now have volumes. Cross-peaks correlate two diagonal peaks by J-coupling or NOE interactions Fourier Transform t1 obtain 2D NMR spectra Peaks along diagonal are normal 1D NMR spectra
Peaks along diagonal are normal 1D NMR spectra Contour map (slice at certain threshold) of 3D representation of 2D NMR spectra. (peak intensity is third dimension Cross-peaks correlate two diagonal peaks by J-coupling or NOE interactions • Multidimensional NMR • Displaying Multiple Dimensions in NMR • Since spectra is 3D, data is typically displayed as contour plot • Single slice through the peak intensity above the noise • Referred to as a threshold • Peaks represented by series of concentric ellipses (contours) • More contour lines more intense the peak
Multidimensional NMR • Displaying Multiple Dimensions in NMR • Appearance of contour plot is directly related to the choice of an appropriate threshold level above the noise. Lower Contour level results in the appearance of noise obscuring the real data High Contour level can easily see the crosspeaks
Multidimensional NMR • Displaying Multiple Dimensions in NMR • A number of 2D NMR spectra have a natural symmetry about the diagonal • Symmetrisation – remove peaks that are not present on both sides of the diagonal • Noise is generally random and will be removed • Real peaks will be present on both sides of the diagonal • Symmetrisation greatly simplifies the spectra and can make interpretation easier • Need to use Extreme Care! • Noise peaks may be coincidentally symmetric (t1 ridges) • Real peaks may have large variations in peak intensity across the diagonal because of distinct relaxation pathways Peaks are from two different compounds, not coupled Symmetrisation creates false crosspeaks because of t1 ridges
Multidimensional NMR • Displaying Multiple Dimensions in NMR • t1 noise or ridges • Remember – the FID collected in the t1 dimension is a sum of individual experiments. • Any fluctuation in the instruments stability between data points will introduce a modulation in the peak intensity that is similar to random noise • Changes in temperature, field/frequency, vibrations, pulse accuracy, spin-rate, etc • Sample is never spun for a 2D experiment t1 ridges or noise
Multidimensional NMR • Displaying Multiple Dimensions in NMR • Sometimes the presentation of the data may need to be change to increase the ease of interpretation Tilt can be Removed by applying a simple mathematical function to the data Experimental Parameters Creates a Tilt in the Spectra
Multidimensional NMR • Processing 2D NMR Data • The t1 FID needs to be processed in a similarly manner to typical 1D data • Proper choice of zero-filling and window function Choice of apodization function has a significant impact on peak shape Decay of Lorentzian peak shape results in t1 ridge, more intense the peak more pronounced the ridge Resolution enhancement Appropriate choice of window function can reduce t1 ridges and decrease peak overlap or interference. May lose sensitivity
Multidimensional NMR • Processing 2D NMR Data • The t1 FID needs to be processed in a similarly manner to typical 1D data • FID needs to be phased • Simulate Real and Imaginary Data • Alternate phase of pulses and receiver • Different peak shapes depending on peak phase • -leads to complicated and overlapped spectra
Multidimensional NMR • Processing 2D NMR Data • Peak phase can be detrimental to data interpretation Diagonal peaks are positively phased Diagonal peaks anti-phase or dispersive
Multidimensional NMR • Processing 2D NMR Data • How Is Phase Information Generated in a 2D Spectra? • Need to collect both the Real (sin) and Imaginary (cos) component of the signal • Need to collect sin and cos modulated data • Phase of peak is determined by the relative phase of pulse and receiver
Multidimensional NMR • Processing 2D NMR Data • How Is Phase Information Generated in a 2D Spectra? • Phase cycling • Collect a series of transients that encodes sin and cos modulations in alternating FIDs along t1 • Number of transients has to be a factor of the phase cycling • 4-step phase cycle need to collect either 4 or 8 or 12, etc transients • Collect twice as many FIDS to phase spectrum Common Phase cycling schemes
Multidimensional NMR • Processing 2D NMR Data • Need to know the phase cycling scheme used in the experiment to properly process the NMR data Phase cycling determines how the data is stored and retrieved States - odd data points are written to the real data array, even data points to the imaginary data array. source 1 2 3 4 = real 1 3 + imaginary 2 4 TPPI - data are copied to the real data array. source 1 2 3 4 = real 1 2 3 4 Echo-antiecho - 4 data points are mixed and written to the real and imaginary data arrays. source 1 2 3 4 = real 1+3 4-2 + imaginary 2+4 1-3 States-TPPI - Same as States, but every second real and imaginary data point is multiplied by -1. source 1 2 3 4 = real 1 -3 + imaginary 2 -4
2D J-Resolved Spectroscopy • Heteronuclear J-resolved 2D NMR • A simple modification of the JMOD experiment • In the 1D version, d2 = 1/J1H-13C • In the 2D version, d2 is replaced by a variable delay t1/2 • Delay is incremented by a constant value • Equivalent to dwell time (DW) in 1D FID • Intensity of 13C resonance will vary as a function of t1/2 • CH : cos(2pt1/J) • CH2: [cos(2(pt1/J)+1] Convert 1D experiment to 2D experiment by changing a constant delay to a delay that is increment by a constant value t2 t1/2
2D J-Resolved Spectroscopy • Heteronuclear J-resolved 2D NMR • Modulation of the peak intensities as a function of the t1 increment • Frequency of amplitude oscillation is ~ to J Series of processed spectra separated by t1 increments • t1 FID at 43.10 ppm • - Number of FIDs determine t1 resolution
2D J-Resolved Spectroscopy • Heteronuclear J-resolved 2D NMR • Correlates 13C Chemical Shifts with 13C-H Coupling Constant • Decouples spectrum can get an accurate count of the number of nuclei • Maximize sensitivity • Also maintain spin-system and easy means to measure coupling constant • Makes it easier to identified spin systems • 13C, 13CH,13CH2, 13CH3
2D J-Resolved Spectroscopy • Heteronuclear J-resolved 2D NMR • Correlates 13C Chemical Shifts with 13C-H Coupling Constant Decoupled 13C NMR spectra Accurate carbon count CH3 CH2 C,CH C Assign carbon-types
2D J-Resolved Spectroscopy • Homonuclear J-resolved 2D NMR • Correlates 1H chemical shifts with H-H coupling constants • Coupling constants are removed simplifies spectrum analysis • Not experimentally possible in 1D spectrum • Peak intensities are modulated by all coupling constants presents • Deconvolutes complex spin systems • Identifies coupled H-H pairs • Share the same coupling constants 180o refocusing pulse t2 Peaks precess at a rate of 1/J, if d2 ≠ 1/2J then peak is not fully re-focused by 180o pulse t1/2
2D J-Resolved Spectroscopy • Homonuclear J-resolved 2D NMR • Correlates 1H chemical shifts with H-H coupling constants Fully decoupled 1H spectrum Accurate count of the number of 1H Without 2D J-resolved spectrum, can not differentiate between two close doublets and a doublet of doublets Fully coupled 1H spectrum How many peaks?
2D J-Resolved Spectroscopy • Homonuclear J-resolved 2D NMR • Correlates 1H chemical shifts with H-H coupling constants • Identify coupled pairs by matching coupling constants
2D COSY Spectroscopy • COSY-90 2D NMR • Correlates chemical shifts that are coupled • P1 is 90o pulse (many varieties) • Diagonal is the normal 1D spectrum • Off-diagonal peaks or cross-peaks identifies nuclei that are coupled Example: diagonal corresponding to A2 should have two cross-peaks connecting to A1 and A3
2D COSY Spectroscopy • COSY-90 2D NMR • Correlates chemical shifts that are coupled A1 & B1 are coupled to A2 & B2 A6 coupled to A5 A6 coupled to A6’ Symmetry peak A2 & B2 are coupled to A1 & B1
2D COSY Spectroscopy • COSY-45 2D NMR • Correlates chemical shifts that are coupled • P1 is 45o pulse • Less sensitive than COSY-90 • Diagonal peaks are weaker • Easier to measure couplings close to diagonal • Easier to measure coupling constant for the observed correlation • Can determine the sign of the coupling constant • Distinguish between 2JHH (-12 to -14 Hz) and 3JHH ( 0 to 16 Hz)
2D COSY Spectroscopy • COSY-45 2D NMR • Correlates chemical shifts that are coupled COSY-90 COSY-45 Peaks are more intense Half the peaks are missing in COSY-45 cross-peak compared to COSY-90 Diagonal is simpler Can measure coupling constatns
2D COSY Spectroscopy • Multiple Quantum Filtration COSY • Add extra 90o right after the last 90o and change phase of pulses • (90o)f---t1---(90o)f(90o)x • Multiple quantum coherence is now observable • Multiple quantum coherence is more phase sensitive • Only coupled peaks can create multiple quantum coherence • Simplifies spectra ( removes solvent peaks) • Better phasing correlations are single peaks • Triple quantum filter removes AX and AB spin systems • Sensitivity falls off rapidly as higher orders are selected
2D COSY Spectroscopy • Heteronuclear COSY • Correlates 1H-13C, 1H-15N or other nuclei chemical shifts with protons (1H) • One bond coupling constants are much larger than two- or three bond coupling • Can differentiate different coupling paths • 1H-13C decoupling occurs during acquisition (t2) 13C singlets Polarization transfer from 1H to 13C, d2=d3=1/2JCH 1H chemical shifts “evolve” during t1 One bond coupling At the end of t1, the 1H magnetization intensity is dependent on its chemical shift 13C pulses makes the 1H-13C doublet out of phase. Waiting 1/2JCH allows the spins to come back into phase Refocuses 1H-13C coupling
2D COSY Spectroscopy • Heteronuclear COSY • Chemical shift evolution • Remember: magnetization vectors will precess in the X,Y plane at a rate relative to the carrier frequency (rotating frame) • At different times (t1) the vector will be at different locations in the X,Y, plane. • Second 1H 90o places the vector along –z where its magnitude is dependent on its position in the X,Y plane • 13C 90o pulse transfers polarization from 1H to 13C and places 13C magnetization in X,Y plane for acquisition • 13C resonance is modulated by 1H chemical shift Counter clockwise – magnetization traveling slower than rotating frame Clockwise – magnetization traveling faster than rotating frame
2D COSY Spectroscopy • Heteronuclear COSY • Correlates 1H and 13C chemical shifts • Thus, if the 1H chemical shifts are assigned the heteronuclear COSY experiment assigns the 13C spectrum or vice versa • No correlation for carbons not directly attached to protons Cross-peaks correlated 1H chemical shifts with 13C chemical shifts
2D COSY Spectroscopy • Heteronuclear COSY • Correlates 1H and 13C chemical shifts through two- and three bond coupling • Adjust d2 &d3 for the smaller 2JCH or 3JCH coupling constants • Will still have some 1JCH • Insert BIRD pulse to “filter” out 1JCH couplings • d4 & d5 are set to 1JCH to reject these correlations BIRD pulse inserted in middle of chemical shift evolution to reject protons directly attached to carbons
2D COSY Spectroscopy • Heteronuclear COSY • Correlates 1H and 13C chemical shifts through two- and three bond coupling • Longer range correlations provide additional structure information • Connect ring systems Provides means to differentiate A & B rings and determine connectivity
2D TOCSY Spectroscopy • TOtal Correlation SpectroscopY • cross peaks are generated between all members of a coupled spin network • NMR resonances for the complete side-chain spin systems is obtained • coherence transfer period occurs during a multi-pulse spin-lock period • length of spin-lock determines how “far” the spin coupling network will be probed • 1/(10 JHH) should be used for each transfer step • not all correlations are observed COSY TOCSY Spin-Lock Pulse (~14ms)
2D TOCSY Spectroscopy • What happens during the spin-lock time cannot be described in terms of vector models or product • operators, because it relies on strong coupling • Under strong coupling, chemical shift differences between different spins become negligible • Two states ab and ba become identical in energy • Instead of transition of single spins, the coherences now involves transitions of combinations of spins • Under this condition, a coherence of one spin is actually in resonance with a coherence of its coupling partner(s) (all with the same frequency), and will oscillate back and forth between all coupled spins
2D INADEQUATE • Connectivity in the Carbon Skeleton of a Molecule • Uses 1J(13C13C) • 13C is only 1.1% abundant only 0.012% of molecule has two connected 13C atoms • Requires very concentrated samples • COSY experiments in theory should give same results, but strong isolated 13C signals will obscure 13C-13C correlations d1 = recycle delay for relaxation d2 = 1/4J13C-13C d3 is now the variable t1 dimension 1H decoupling on throughout experiment t1
C3-C4 C3-C2 • 2D INADEQUATE • Connectivity in the Carbon Skeleton of a Molecule • Cross-peaks identified chemical shifts of coupled 13C nuclei • Chemical shifts identifies functional groups
2D NOESY (Nuclear Overhauser Effect) • Connectivity through Space • Cross-peaks identify chemical shifts of nuclei (1H) close in space (≤ 5Å) • NOE builds-up during mixing time • Relaxation through dipole-dipole interaction • Signal is decaying while NOE builds-up • NOE intensity is a fraction of signal intensity • NOESY experiment is less sensitive than NOE difference experiment • Observe all correlations at once, less of a problem from poor chemical shift dispersion • NOE difference – only correlations related to irradiated resonance • NOE difference - requires obtaining multiple experiments • NOE difference – difficulties with specific irradiation of closely overlapped resonances NOE is a relaxation factor that builds-up during The “mixing-time (tm)”
2D NOESY (Nuclear Overhauser Effect) • Connectivity through Space • May observe correlations that can not be detected from coupling constants • Useful for connecting distinct fragments of the protein • Combine COSY and NOESY data together • Provides information about the three-dimensional structure of the molecule • Especially useful for larger molecules with many rotatable bonds Relative magnitude of the cross-peak is related to the distance (1/r6) between the protons (≥ 5Ǻ). 4-bonds
2D NOESY (Nuclear Overhauser Effect) • Connectivity through Space • May observe correlations that can not be detected from coupling constants • NOE between CH and A1 is the primary factor to distinguish the A and B sugar ring assignments • Can also observe heteronuclear NOEs, but 1H-1H NOEs are most common
2D ROESY • Connectivity through Space • Remember: NOE changes its sign as correlation time (tc) increases (increase in MW) • Cross-over point when the NOE is zero • NOESY experiments are problematic when MW > 1000 • Biopolymers are large enough MW that the NOE is negative • Use Spin-Lock • Reduces effective NMR frequency range from MHz to KHz • tc is very short relative to w positive NOE range Problem region for NOESY
2D ROESY • Connectivity through Space • Remember: NOE changes its sign as correlation time (tc) increases (increase in MW) • Cross-over point when the NOE is zero • NOESY experiments are problematic when MW > 1000 • Biopolymers are large enough MW that the NOE is negative • Use Spin-Lock • Reduces effective NMR frequency range from MHz to KHz • tc is very short relative to w positive NOE range ROE “mixing-time” ~ 300 ms
2D ROESY • ROESY & NOESY • ROESY generally more sensitive than NOESY • Longer irradiation time • ROESY also has coupling correlations • Same process as TOCSY • Complicate interpretation • Is peak a ROESY or TOCSY peak? • Does ROESY peak intensity also include TOCSY intensity? NOESY ROESY
Inverse Detection • Increase Sensitivity of Experiments • Acquire the signal (FID) for the most sensitive nuclei (usually 1H) in the spin system • Instead of directly observing the nuclei that is being modulated • Gain in sensitivity is ~ (gH/gX)5/2 • ~ 31.6 gain in sensitivity for direct detected 13C spectrum • Reverse detection is the preferred approach • 13C have larger frequency ranges requires collecting more spectra/points in t1 dimension • Other nuclei may have very long 90o pulse doesn’t cover entire frequency range
Inverse Detection • HMQC (Heteronuclear Multiple Quantum Coherence) • 1H, X correlation experiment • Selects for one bond 1H-13C couplings • Uses BIRD selection and GARP decoupling • Alternative to heteronuclear COSY • HMQC more sensitive 1H 90o generate X,Y 1H magnetization 1H 180o refocusing pulse BIRD pulse (excluding p7) Detect 1H signal d1 = recycle delay for relaxation d2 = 1/2J1H-13C d3 is BIRD delay optimized for minimal 1H signal select 1H attached to 13C GARP – remove 1H-13C splitting pattern 13C chemical shift evolution Polarization transfer to 1H 1H signal modulated by 13C chemical shift
Inverse Detection • HMQC (Heteronuclear Multiple Quantum Coherence) • Correlates 1H and 13C chemical shifts • Thus, if the 1H chemical shifts are assigned the HMQC experiment assigns the 13C spectrum or vice versa • No correlation for carbons not directly attached to protons • Higher sensitivity and preferred over heteronuclear COSY Cross-peaks correlated 1H chemical shifts with 13C chemical shifts
Inverse Detection • HMBC (Heteronuclear Multiple Bond Correlation) • Correlates 1H and 13C chemical shifts • Optimized to observe two- and three-bond 1H-13C couplings • Again, similar to heteronuclear COSY optimized for two- and three-bond couplings • Higher sensitivity and preferred over heteronuclear COSY • HMBC experiment is probably the most important experiment for solving the structure of a completely unknown compound • Natural products extracted from a variety of organisms 1H 180o refocusing pulse 1H 90o generate X,Y 1H magnetization Detect 1H signal d1 = recycle delay for relaxation d2 = 1/2J1H-13C d3 is BIRD delay optimized for minimal 1H signal select 1H attached to 13C d4 = 1/2nJ, n= 2 or 3 two or three bond 1H-13C coupling d5 = d2-d4 GARP – remove 1H-13C splitting pattern BIRD pulse 13C chemical shift evolution Polarization transfer to 1H 1H signal modulated by 13C chemical shift
Inverse Detection • HMBC and HMQC • Combines short and long range coupling to piece together the structure • Powerful set of experiments for solving the structure of a complete unknown • HSQC experiment - provides same information but sharper lines compared to HMQC • Removes 1H-1H coupling HMBC HMQC
3D & 4D NMR • similar to 2D NMR with either three or four time domains. • additional dimensions usually correspond to 13C & 15N chemical shifts. • primarily used for analysis of biomolecular structures • disperses highly overlapped NMR spectra into 3 & 4 dimensions, simplifies analysis. • one experiment may take 2.5 to 4 days to collect. • diminished resolution and sensitivity t1, t2,t3