Download

1 / 29
300 likes | 681 Views
Chapter 11 Other Chi-Squared Tests. Chi-Square Statistic. Measures how far the observed values are from the expected values Take sum over all cells in table When is large, there is evidence that H 0 is false. Goodness of Fit (GOF) Tests.

E N D
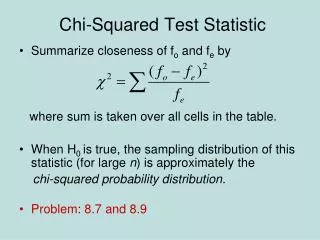
Chi-Square Statistic • Measures how far the observed values are from the expected values • Take sum over all cells in table • When is large, there is evidence that H0 is false.
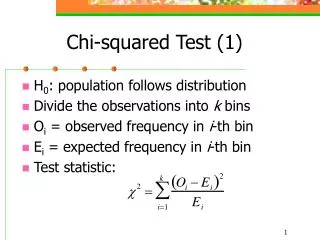
Goodness of Fit (GOF) Tests • We can use a chi-squared test to see if a frequency distribution fits a pattern. • The hypotheses to these tests are written a little different than we have seen in the past because they are usually written in words.
GOF Hypothesis Test • A researcher wishes to see of the number of adults who do not have health insurance is equally distributed among three categories:
GOF Hypothesis Test • Step 1 • Ho: The number of people who do not have health insurance is equally distributed over the three categories. • Ha: The number of people who do not have health insurance is not equally distributed over the three categories.
GOF Hypothesis Test • Step 2 • α = 0.05 • Step 3
GOF Hypothesis Test • Step 4 • Test Statistic = 8.1 • Put Observed in L1 and Expected in L2 • L3 = (L1-L2)2 / L2 • Sum L3 • χ2 cdf (test stat, E99, df) = p-value = 0.017
GOF Hypothesis Test • Step 5 • Reject Ho • Step 6 • There is enough evidence to suggest that the number of people who do not have health insurance is not equally distributed over the three categories.
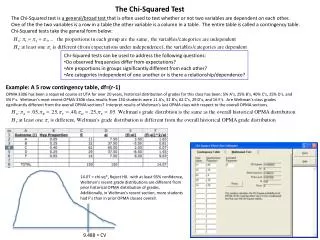
Two-Way Tables • Summarizes the relationship between two categorical variables • Row = values for one categorical variable • Column = values for other categorical variable • Table entries = number in row by column class
Independence of Categorical Variables. • Is there a relationship between two categorical variables. Are two variables related to each other? • Unrelated = independent • Related = dependent
Example • A 1992 poll conducted by the University of Montana classified respondents by sex and political party. • Sex: Male and Female • Party: Democrat, Republican, Independent • Is there evidence of an association between gender and party affiliation?
Hypothesis Test for Independence • HO: Sex and political party affiliation are independent (have no relationship). • HA: Sex and political party affiliation are dependent (are related to each other.)
Two-Way Tables • Describe table with # of rows (r) and # of columns (c) • r x c table • Each number in table is called a cell • r times c cells in table • We will use the two-way table to test our hypotheses.
Expected Counts • If HO is true, we would expect to get a certain number of counts in each cell. Expected cell count = row total * column total table total
Example of Expected Counts • Cell – Male and Democrat • Expected Count = • Cell – Male and Republican • Expected Count = • Cell – Male and Independent • Expected Count =
Expected Counts • Expected cell count is close to observed cell count • Evidence Ho is true • Expected cell count is far from observed cell count • Evidence Ho is false
Chi-Squared Test for Independence • To test these hypotheses, we will use a Chi-Squared Test for Independence if the assumptions hold. • Assumptions: • Expected Cell Counts are all > 5
Chi-Square Statistic • Measures how far the observed values are from the expected values • Take sum over all cells in table • When is large, there is evidence that H0 is false. • Your calculator will do this for you.
Chi-Square Statistic • Cell – Male and Democrat • Observed Count = 36 • Expected Count = 43.66 • Cell – Male and Republican • Observed Count = 45 • Expected Count = 40.54
Chi-Square Statistic • Repeat this process for all 6 cells • χ2 = 4.85 • As long as the assumptions are met • χ2 will have a χ2 distribution with d.f. (r-1)(c-1) • Sex has 2 categories (so r = 2); party has 3 categories (so c = 3) • We have (2-1)(3-1) = 2 degrees of freedom
Hypothesis Test • P-value = P(χ2 > 4.85)= 0.09 • Decision: Since p-value > α = 0.05, we will Do Not Reject HO. • Conclusion: There is no evidence of a relationship between sex and political party affiliation.
Homogeneity of Proportions • Samples are selected from different populations and a researcher wants to determine whether the proportion of elements are common for each population. • The hypotheses are: • Ho: p1 = p2 = p3 = p4 • Ha: At least one is different
Homogeneity of Proportions • An advertising firm has decided to ask 92 customers at each of three local shopping malls if they are willing to take part in a market research survey. According to previous studies, 38% of Americans refuse to take part in such surveys. At α = 0.01, test the claim that the proportions are equal.
Homogeneity of Proportions • Step 1 • Ho: p1 = p2 = p3 • Ha: At least one is different • Step 2 • α = 0.01 • Step 3
Homogeneity of Proportions • Step 4 • Put into your calculator • Observed in matrix A • Expected in matrix B • Test statistic = 5.602 • P-value = 0.06
Homogeneity of Proportions • Step 5 • Do Not Reject Ho • Step 6 • There is not sufficient evidence to suggest that at least one is different.