Download
1 / 39
400 likes | 574 Views
Mutual Funds and Other Investment Companies. 4. Bodie, Kane, and Marcus Essentials of Investments, 9 th Edition. 4.1 Investment Companies. Functions Record keeping and administration Diversification and divisibility Professional management Lower transaction costs Definitions

E N D
Mutual Funds and Other Investment Companies 4 Bodie, Kane, and Marcus Essentials of Investments, 9th Edition
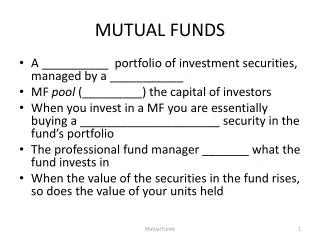
4.1 Investment Companies • Functions • Record keeping and administration • Diversification and divisibility • Professional management • Lower transaction costs • Definitions • Investment company: Financial intermediaries • Net asset value (NAV): Assets minus liabilities per share
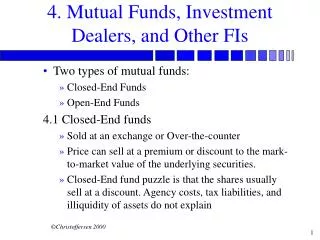
4.2 Types of Investment Companies • Unit Investment Trusts • Money pooled from many investors is invested in portfolio fixed for life of fund • Managed Investment Companies • Open-end fund: Issues or redeems shares at net value • Closed-end fund: Shares can’t be redeemed, are traded at prices different than NAV • Load: Sales commission charged on mutual fund
4.2 Types of Investment Companies • Open-End and Closed-End Funds: Key Differences • Shares Outstanding • Closed-end: No change unless new stock offered • Open-end: Changes when new shares are sold or old shares are redeemed • Pricing • Open-end: Fund share price = Net asset value (NAV) • Closed-end: Fund share price may trade at premium or discount to NAV
4.2 Types of Investment Companies • Other Investment Organizations • Commingled Funds • Partnership of investors pooling funds; designed for trusts/larger retirement accounts to get professional management for fee • Real Estate Investment Trusts (REITs) • Similar to closed-end funds, invests in real estate/real estate loans • Hedge Funds • Private speculative investment pool, exempt from SEC regulation
4.3 Mutual Funds • Investment Policies • Money market funds • Commercial paper, repurchase agreements, CDs • Equity funds • Invest in stock, some fixed-income, or other securities • Specialized sector funds • Concentrate on particular industry • Bond funds • Specialize in fixed-income (bonds) sector
4.3 Mutual Funds • Investment Policies • International funds • Global funds invest in securities worldwide, including U.S. • International funds invest outside U.S. • Regional funds focus on particular part of world • Emerging market funds invest in developing nations
4.3 Mutual Funds • Investment Policies • Balanced funds • Hold both equities and fixed-income securities in stable proportion • Life-cycle funds: Asset mix ranges from aggressive to conservative • Static allocation funds maintain stable mix across stocks and bonds • Targeted maturity funds become more conservative as investor ages • Funds of funds: Mutual funds that primarily invest in other mutual funds
4.3 Mutual Funds • Investment Policies • Asset allocation and flexible funds • Stocks and bonds—proportion varies according to market forecast • Index funds • Try to match performance of broad market index • Buy shares in securities included in particular index in proportion to security’s representation in index
4.4 Costs of Investing in Mutual Funds • Fee Structure • Operating expenses: Costs incurred by mutual fund in operating portfolio • Front-end load: Commission or sales charge paid when purchasing shares • Back-end load: “Exit” fee incurred when selling shares • 12b-1 charges: Annual fees charged by mutual fund to pay for marketing/distribution costs
4.4 Costs of Investing in Mutual Funds • Fees, Loads, and Performance • Gross performance of load funds is statistically identical to gross performance of no-load funds • Funds with high expenses tend to be poorer performers • 12b-1 charges should be added to expense ratios • Compare costs with Morningstar
4.4 Costs of Investing in Mutual Funds • NAV and Effective Load • Cost to initially purchase one share of load fund = NAV + Front-end load (%) (if any) • Stated loads typically range from 0 to 8.5% • Load is designed to offset expenses of marketing the fund; it goes to broker who sells fund to investor • Effective load greater than stated load
4.4 Costs of Investing in Mutual Funds • Avoiding the Load • Choose different class of fund shares Notes: a Depending on size of investment. b Depending on years until holdings are sold. c Including service fee of .25%.
4.4 Costs of Investing in Mutual Funds • Fees and Mutual Fund Returns • Soft dollars: Value of research services brokerage house provides “free of charge” in exchange for business
Table 4.2 Impact of Costs on Investment Performance Notes: Fund A is no-load with .5% expense ratio, Fund B is no-load with 1.5% total expense ratio, and Fund C has an 8% load on purchases and a 1% expense ratio. Gross return on all funds is 12% per year before expenses. * After front-end load, if any.
4.5 Taxation of Mutual Fund Income • General Tax Rules • Fund not taxed if diversified and income distributed • Investor taxed on capital gain and dividend distributions • Turnover: Ratio of trading activity to assets of portfolio • Portfolio turnover may affect investor’s tax liability
4.5 Taxation of Mutual Fund Income • Implications of Fund Turnover • Fund pays commission costs on portfolio purchases and sales—charged against NAV • Turnover rate measured as annual total asset value bought or sold in a year divided by average total asset value
4.6 Exchange-Traded Funds • Exchange-Traded Funds: Offshoots of mutual funds that allow investors to trade index portfolios • Potential Advantages • Trade continuously throughout day • Can be sold or purchased on margin • Potentially lower tax rates • Lower costs (no marketing, lower fund expenses)
4.6 Exchange-Traded Funds • Potential Disadvantages • Small deviations from NAV possible • Brokerage commission to buy ETF
Figure 4.3 Investment Company Assets under Management, 2010 ($ Billion)
4.7 Mutual Fund Investment Performance • On average, mutual fund performance less than broad market performance • Evidence suggests some persistence in positive performance over certain horizons
Figure 4.4 Average Returns on Diversified Equity Funds vs. Wilshire 5000 Index
4.8 Information on Mutual Funds • Sources of Information on Mutual Funds • Morningstar (www.morningstar.com) • Fund prospectus • Yahoo! • The Wall Street Journal • Investment Company Institute (www.ici.org) • American Institute of Individual Investors • Brokers
Sample Problems 4-29
Problem 1 $.94 NAV = 1 - load $11.38 $10.70 = 1-.06 NAV is $10.70 Front-end load is 6% Every dollar paid results in only ____ going toward purchase of shares. Offer price = 4-30
Problem 2 $.95 offer price x (1- load) Offer price $12.30 Front-end load is 5% Every dollar paid results in only ____ going toward purchase of shares. NAV = = $12.30 x 0.95 = $11.69 4-31
Problem 3 Liabilities $30,000 Shares Outstanding 4,000,000 NAV = (Market Value of Assets – Liabilities) Shares Outstanding A. (200,000)x($35) = $ 7,000,000 B. (300,000)x($40) = $12,000,000 C. (400,000)x($20) = $ 8,000,000 D. (600,000)x($25) = $15,000,000 $42,000,000 $42,000,000 – $30,000 = $10.49 = NAV 4,000,000 4-32
Problem 4 MVA = $42M Market Value Assets = $42,000,000 AHP = 0.5 x 1/Turnover = 0.5 x 1/0.357 = 1.4 yrs Turnover rate = Value of stocks sold and replaced Market Value Assets Value of stocks sold = (600,000x$25)= $15,000,000 or Value of stocks purchased = (200kx$50)+(200kx$25) = $15,000,000 $15,000,000 = 0.357 or 35.7%$42,000,000 Average holding period? 4-33
Problem 5 The empirical research suggests that past performance is not highly predictive of future performance, especially for better performing funds. There may be some tendency for the fund to perform better than average next year, but it is unlikely that the fund will be in the top 10%. Evidence suggests that bad performance is more likely to persist. Probably related to high fund costs or high turnover rates. Excessive costs are detrimental to a fund’s returns. 4-34
Problem 6 ($22,160 $20,833) / $20,833 = 6.37% • As an initial approximation, your return equals the return on the shares minus the total of the expense ratio and purchase costs: • Return 12% 1.2% 4% = 6.8% • But the precise return is less than this because the 4% load is paid up front, not at the end of the year. To purchase the shares, you would have had to invest: • $20,000 / (1 0.04) = $20,833 • The shares net increase in value (12% 1.2%) from $20,000 to: • $20,000 (1.12 0.012) = $22,160 • The rate of return is: 4-35
Problem 7 $940 • Sell after 4 years: Suppose you have $1000 to invest. The initial investment in Class A shares is ____ net of the front-end load. After 4 years, your portfolio will be worth: $940 (1.10)4 = $1,376.25 Class B shares allow you to invest the full $1,000, but your investment performance net of 12b-1 fees will be only 9.5%, and you will pay a 1% back-end load fee if you sell after 4 years. Your redemption value after 4 years will be: $1,000 (1.095)4 x 0.99 = $1,423.28 Class B shares are the better choice if your horizon is 4 years. 4-36
Problem 7 Cont. $3,926.61 N x LN [1.10 / 1.095] $3,901.32 • Sell after 15 years: With a 15-year horizon, the Class A shares will be worth: $940 (1.10)15 = For the Class B shares, there is no back-end load in this case since the horizon is greater than 5 years. Therefore, the value of the Class B shares will be: $1,000 (1.095)15 = At this longer horizon, Class A shares are the better choice. Why? 4-37
Problem 8 • Suppose that finishing in the top half of all portfolio managers is purely luck, and that the probability of doing so in any year is exactly 50%. • Then the probability that any particular manager would finish in the top half of the sample five years in a row is 0.505 = 0.03125. • We would then expect to find that [350 0.03125] 11 managers finish in the top half for each of the five consecutive years. 4-38
Problem 9 Trading costs will reduce the portfolio return by (0.4%)x(0.50)= 0.2% • Over many years of savings these costs can greatly reduce the value of your portfolio. • Remember also that the high turnover rate can have tax consequences that further reduces your after-tax return. 4-39