Java Virtual Machine Profiling
Java Virtual Machine Profiling. Agenda. Introduction JVM overview Performance concepts Monitoring Profiling VisualVM demo Tuning Conclusions. Introduction. What? Monitoring JVM -> Profiling JVM -> Tuning. Who? Java SE developers, Java EE developers, Java architects, Java apps admin.

Java Virtual Machine Profiling
E N D
Presentation Transcript
Agenda • Introduction • JVM overview • Performance concepts • Monitoring • Profiling • VisualVM demo • Tuning • Conclusions
Introduction • What? Monitoring JVM -> Profiling JVM -> Tuning • Who? Java SE developers, Java EE developers, Java architects, Java apps admin • What not? SO perf, I/O perf, Network perf, JIT perf
Performance basics • Memory footprint • Startup time • Scalability • Responsiveness • Throughput
Performance methodology • Monitoring • Not intrusive: observe behavior, not overload • For development/production • For troubleshooting: identify issues • Tuning info for: JVM issues (heap size, GC optimization, JIT bugs) • Profiling • More intrusive: analyze your code, cause overload • For development: get performance data in a running app • For troubleshooting: focus on the issues • Tuning info for: code issues (memory leaks, lock contentions) • Tuning • Known performance requirements • Monitoring and/or profiling, then compare with requirements • Modify JVM arguments or source code • Incorporating performance in development • Analysis -> Design -> Code -> Benchmark -> Profile -> Deploy
Monitoring • What to monitor? • CPU usage • Java heap usage, • # of threads • GC: frequency and duration • JIT: frequency, duration, opt/de-opt cycles, failed compilations • Result • Identify Java heap tuning • GC tuning • Tools for monitoring • -verbose: gc, • -XX:+PrintGCDetails, -XX:PrintCompilation • Jstat • JConsole, VisualVM, VisualGC
Profiling • CPU profiling • When: large amount of CPU time • Look for: methods with a high self-time • Output: throughput issues, identify algorithm and designs issues • Heap profiling • When: GC runs frequently, large Java heap • Look for: very large allocated objects, small objects allocated at a high rate • Output: throughput/responsiveness issues, memory allocation patterns, memory strategies (alternative APIs, caching solutions)
Profiling (continued) • Memory leaks: reference to allocated object remains unintentionally reachable and cannot be GC'ed. • When: Java heap grow over time w/o bound, OOM errors • Look for: abnormal memory consumption, • Output: code errors • Lock contention: large number of context switches, related to CPU utilization • When: manual use of threads • Look for: high number of context switches, many threads in wait state • Output: code errors. • Toolsfor profiling • Netbeans profiler • jmap, jhat • -XX: +HeapDumpOnOutOfMemoryError • VisualVM
Profiling tools Included in <JDK_HOME>/bin for JDK 1.5+, except jhat (JDK 6+) and jvisualvm (JDK 6 update 7+) • jps: listtheinstrumentedHotSpotVM’sforthecurrentuser in the target system. • jinfo: printssystemproperties and command-line flagsused in a JVM • jmap: printsmemoryrelatedstatisticsfor a running VM orcorefile • jhat: parses a heapdump in binaryformat and startsan HTTP server tobrowsedifferentqueries (JDK 6) • jstat: providesinformationon performance and resourceconsumption of runningapplicationsusingthebuilt-in instrumentation in theHotSpot VM. • jstack: printsthestack traces of allthethreadsattachedtothe JVM, including Java threads and VM internalthreads. Alsoperformsdeadlockdetection • jconsole: uses thebuild-in JMX instrumentation in the JVM toprovideinformationon performance and resourceconsumption of runningapplications • jvisualvm: usefultotroubleshootapplications and to monitor and improveapplication’s performance. Ithelpsotgenerate and analyzeheapdumps, trackdownmemoryleaks, perform and monitor garbagecollection, and performlightweigthmemory and CPU profiling.
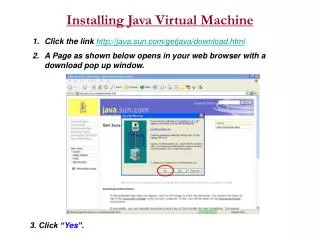
VisualVM demo • The bleeding-edge distribution of jvisualvm, with the latest features and bug fixes. • Download software: http://visualvm.java.net/ (current version 1.3.5) • Enable JVM profiling • -Dcom.sun.management.jmxremote=true: Registers the JVM instrumentation MBeans and publishes the RMI connector via a private interface to allow JMX client applications to monitor a local JVM. • -Xshare:off: Disable class data sharing • -javaagent:<VISUALVM_HOME>/profiler/lib/jfluid-server.jar: Specify where is the profiler agent • Start VisualVM • # <JVISUALVM_HOME>/bin/visualvm –-jdkhome <JDK_HOME>
Tuning • Java heap and stack tuning
Tuning (continued) • Heap and lock contention issues: • Avoid create objects where primitives could be used (autoboxing is not for free) • Avoid String concatenations, use StringBuilder with append() • Avoid StringBuilder overallocation, set initial size to reduce resizing • Avoid use of synchronized keyword, look for a java.util.concurrent solution • Use java.util.concurrent API instead of "synchronized" Collections • Don't use exceptions for flow control (Exception objects allocation), use flow control constructs (if/else, return, switch). • Don't generate stack traces, they're expensive operations. • Reduce number of system calls: • Avoid accessing disk: use large buffers or direct buffering • Avoid accessing to underlying OS • Avoid processing bytes and characters individually • Never implement finalize(): pain in the ass for GC • GC issues: not covered
Conclusions • JDK offersveryuseful utilities to troubleshoot and manage performance issues with JVM. • We can use them not only when a performance issue happens, but to understand what is the behavior of the application and where could be improve it. • Incorporate performance benchmarks in your development cycle. Thanks!
References • Memory Management in the Java HotSpot Virtual Machine • http://java.sun.com/j2se/reference/whitepapers/memorymanagement_whitepaper.pdf • Troubleshooting Guide for Java SE 6 withHotSpot VM • http://www.oracle.com/technetwork/java/javase/toc-135973.html • JDK Utilities • http://download.oracle.com/javase/6/docs/technotes/tools/share/jps.html • http://download.oracle.com/javase/6/docs/technotes/tools/share/jinfo.html • http://download.oracle.com/javase/6/docs/technotes/tools/share/jmap.html • http://download.oracle.com/javase/6/docs/technotes/tools/share/jhat.html • http://download.oracle.com/javase/6/docs/technotes/tools/share/jstat.html • http://download.oracle.com/javase/6/docs/technotes/tools/share/jstack.html • http://download.oracle.com/javase/6/docs/technotes/tools/share/jconsole.html • http://download.oracle.com/javase/6/docs/technotes/tools/share/jvisualvm.html • Visual VM • http://visualvm.java.net/ • JVM HotSpotoptions • http://www.oracle.com/technetwork/java/javase/tech/vmoptions-jsp-140102.html