Download
1 / 18
230 likes | 393 Views
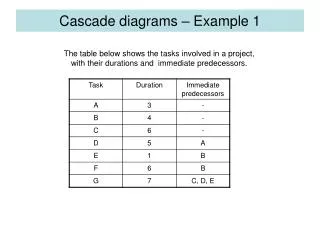
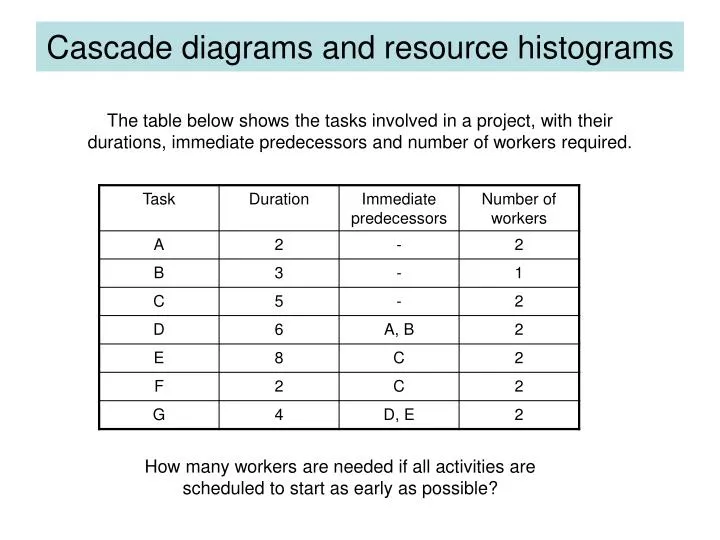
Cascade diagrams and resource histograms. The table below shows the tasks involved in a project, with their durations, immediate predecessors and number of workers required. How many workers are needed if all activities are scheduled to start as early as possible?.

E N D
Cascade diagrams and resource histograms The table below shows the tasks involved in a project, with their durations, immediate predecessors and number of workers required. How many workers are needed if all activities are scheduled to start as early as possible?
Cascade diagrams and resource histograms Initially, put all tasks at their earliest possible time. A (2) B (1) A, B and C can all start at time zero. C (2) D E F G Days 2 4 6 8 10 12 14 16
Cascade diagrams and resource histograms D must start after both A and B have finished A (2) B (1) C (2) D (2) E F G Days 2 4 6 8 10 12 14 16
Cascade diagrams and resource histograms E and F must both start after C has finished A (2) B (1) C (2) D (2) E (2) F (2) G Days 2 4 6 8 10 12 14 16
Cascade diagrams and resource histograms G must start after both D and E have finished A (2) B (1) C (2) D (2) E (2) F (2) G (2) Days 2 4 6 8 10 12 14 16
6 4 2 2 4 6 8 10 12 14 16 Cascade diagrams and resource histograms A You can now use the cascade diagram to construct a resource histogram showing the number of workers needed on each day (2) B (1) C (2) D (2) E (2) F (2) G (2) Days 2 4 6 8 10 12 14 16 This shows that 6 workers are required
Cascade diagrams and resource histograms Problem 1 Only four workers are available. Is it possible to complete the project in the same amount of time?
(1) (2) Cascade diagrams and resource histograms A We need to move some tasks so that only four workers are needed at any given time. (2) B C (2) Task B can be moved so that it starts after A has finished. This means that D must also move. D E (2) F (2) G (2) Days 2 4 6 8 10 12 14 16 6 4 2 2 4 6 8 10 12 14 16
(1) (2) Cascade diagrams and resource histograms A The resource histogram is changed to show this new arrangement. (2) B C (2) D E (2) F (2) G (2) Days 2 4 6 8 10 12 14 16 6 6 workers are still needed 4 2 2 4 6 8 10 12 14 16
Cascade diagrams and resource histograms A Task F can be moved forward to start after D finishes. (2) B (1) C (2) D (2) E (2) F (2) G (2) Days 2 4 6 8 10 12 14 16 6 4 2 2 4 6 8 10 12 14 16
Cascade diagrams and resource histograms A The resource histogram changes again. (2) B (1) C (2) D (2) E (2) F (2) G (2) Days 2 4 6 8 10 12 14 16 6 Now only 4 workers are needed. 4 2 2 4 6 8 10 12 14 16
Cascade diagrams and resource histograms Problem 2 Only three workers are now available. However, both tasks D and F can be done by one person, but taking double the amount of time. What is the shortest possible time in which the project can be completed?
Cascade diagrams and resource histograms A This is the new cascade diagram, with D and F done by one person taking twice as long. (2) B (1) C (2) D (1) E (2) F (1) G (2) Days 2 4 6 8 10 12 14 16 18
6 4 2 2 4 6 8 10 12 14 16 18 Cascade diagrams and resource histograms A A new resource histogram is needed. (2) B (1) C (2) D (1) E (2) F (1) G (2) Days 2 4 6 8 10 12 14 16 18
(2) (2) (1) 6 4 2 2 4 6 8 10 12 14 16 18 Cascade diagrams and resource histograms A Since BDG is now the critical path, it is probably best to try moving C. This means that E and F must also move. (2) B (1) C D (1) E F G (2) Days 2 4 6 8 10 12 14 16 18
(2) (1) (2) (1) (2) (1) (2) 6 4 2 2 4 6 8 10 12 14 16 18 Cascade diagrams and resource histograms A The resource histogram changes B C D E F G Days 2 4 6 8 10 12 14 16 18
6 4 2 2 4 6 8 10 12 14 16 18 Cascade diagrams and resource histograms A Another change is needed. F is not required for any other task, so it can be moved later. (2) B (1) C (2) D (1) E (2) F (1) G (2) Days 2 4 6 8 10 12 14 16 18
6 4 2 2 4 6 8 10 12 14 16 18 Cascade diagrams and resource histograms A The resource histogram changes again … (2) B (1) … and this time it shows that the project can be completed using 3 people in 19 days. C (2) D (1) E (2) F (1) G (2) Days 2 4 6 8 10 12 14 16 18