Download
1 / 47
470 likes | 501 Views
Learning from Learning Curves using Learning Factors Analysis. Hao Cen, Kenneth Koedinger, Brian Junker Human-Computer Interaction Institute Carnegie Mellon University.

E N D
Learning from Learning Curves using Learning Factors Analysis Hao Cen, Kenneth Koedinger, Brian Junker Human-Computer Interaction Institute Carnegie Mellon University Cen, H., Koedinger, K., Junker, B. Learning Factors Analysis - A General Method for Cognitive Model Evaluation and Improvement. the 8th International Conference on Intelligent Tutoring Systems. 2006. Science, 26(2)Cen, H., Koedinger, K., Junker, B. Is Over Practice Necessary? Improving Learning Efficiency with the Cognitive Tutor. The 13th International Conference on Artificial Intelligence in Education (AIED 2007). 2007.
Production Rule Analysis Evidence for Production Rule as an appropriate unit of knowledge acquisition
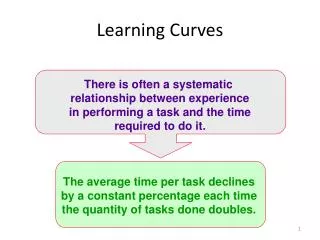
Using learning curves to evaluate a cognitive model • Lisp Tutor Model • Learning curves used to validate cognitive model • Fit better when organized by knowledge components (productions) rather than surface forms (programming language terms) • But, curves not smooth for some production rules • “Blips” in leaning curves indicate the knowledge representation may not be right • Corbett, Anderson, O’Brien (1995) • Let me illustrate …
What’s happening on the 6th & 10th opportunities? Curve for “Declare Parameter” production rule • How are steps with blips different from others? • What’s the unique feature or factor explaining these blips?
Can modify cognitive model using unique factor present at “blips” • Blips occur when to-be-written program has 2 parameters • Split Declare-Parameter by parameter-number factor: • Declare-first-parameter • Declare-second-parameter
Learning curve analysis by hand & eye … • Steps in programming problems where the function (“method”) has two parameters (Corbett, Anderson, O’Brien, 1995)
Can learning curve analysis be automated? • Learning curve analysis • Identify blips by hand & eye • Manually create a new model • Qualitative judgment • Need to automatically: • Identify blips by system • Propose alternative cognitive models • Evaluate each model quantitatively
Overview • Learning Factors Analysis algorithm • A Geometry Cognitive Model and Log Data • Experiments and Results
Learning Factors Analysis (LFA): A Tool for KC Analysis • LFA is a method for discovering & evaluating alternative cognitive models • Finds knowledge component decomposition that best predicts student performance & learning transfer • Inputs • Data: Student success on tasks in domain over time • Codes: Hypothesized factors that drive task difficulty • A mapping between these factors & domain tasks • Outputs • A rank ordering of most predictive cognitive models • For each model, a measure of its generalizability & parameter estimates for knowledge component difficulty, learning rates, & student proficiency
Learning Factors Analysis (LFA) draws from multiple disciplines • Machine Learning & AI • Combinatorial search (Russell & Norvig, 2003) • Exponential-family principal component analysis (Gordon, 2002) • Psychometrics & Statistics • Q Matrix & Rule Space (Tatsuoka 1983, Barnes 2005) • Item response learning model (Draney, et al., 1995) • Item response assessment models (DiBello, et al., 1995; Embretson, 1997; von Davier, 2005) • Cognitive Psychology • Learning curve analysis (Corbett, et al 1995)
Steps in Learning Factors Analysis We’ve talked about some of these steps 1-4 before …
LFA – 1. The Q Matrix How to represent relationship between knowledge components and student tasks? Tasks also called items, questions, problems, or steps (in problems) Q-Matrix (Tatsuoka, 1983) 2* 8 is a single-KC item 2*8 – 3 is a conjunctive-KC item, involves two KCs What good is a Q matrix? Used to predict student accuracy on items not previously seen, based on KCs involved 13
LFA – 2. The Statistical Model Problem: How to predict student responses from model? Solutions: Additive Factor Model (Draney, et al. 1995, Cen, Koedinger, Junker, 2006)
LFA – 2. An alternative “conjunctive” model Conjunctive Factor Model (Cen, Koedinger, Junker, 2008)
LFA - 4. Model Evaluation • How to compare cognitive models? • A good model minimizes prediction risk by balancing fit with data & complexity (Wasserman 2005) • Compare BIC for the cognitive models • BIC is “Bayesian Information Criteria” • BIC = -2*log-likelihood + numPar * log(numOb) • Better (lower) BIC == better predict data that haven’t seen • Mimics cross validation, but is faster to compute 16
LFA – 5. Expert Labeling & P-Matrix Problem: How to find the potentials to improve the existing cognitive model? Solution: Have experts look for difficulty factors that are candidates for new KCs. Put these in P matrix. Q Matrix P Matrix
LFA – 5. Expert Labeling and P-Matrix Operators on Q and P Q + P[,1] Q[, 2] * P[,1] Q- Matrix after add P[, 1] Q- Matrix after splitting P[, 1], Q[,2]
LFA – 6. Model Search • Problem: How to find best model given P-matrix? • Solution: Combinatorial search • A best-first search algorithm (Russell & Norvig 2002) • Guided by a heuristic, such as BIC • Start from an existing model
Combinatorial Search • Goal: Do model selection within the logistic regression model space Steps: • Start from an initial “node” in search graph • Iteratively create new child nodes by splitting a model using covariates or “factors” • Employ a heuristic (e.g. fit to learning curve) to rank each node • Expand from a new node in the heuristic order by going back to step 2
LFA – 6. Model Search Automates the process of hypothesizing alternative KC models & testing them against data
Overview • Learning Factors Analysis algorithm • A Geometry Cognitive Model and Log Data • Experiments and Results
Domain of current study • Domain of study: the area unit of the geometry tutor • Cognitive model: 15 skills • Circle-area • Circle-circumference • Circle-diameter • Circle-radius • Compose-by-addition • Compose-by-multiplication • Parallelogram-area • Parallelogram-side • Pentagon-area • Pentagon-side • Trapezoid-area • Trapezoid-base • Trapezoid-height • Triangle-area • Triangle-side
The Split • Binary Split -- splits a skill a skill with a factor value, & a skill without the factor value. After Splitting Circle-area by Embed
The Heuristics • Good model captures sufficient variation in data but is not overly complicated • balance between model fit & complexity minimizing prediction risk (Wasserman 2005) • AIC and BIC used as heuristics in the search • two estimators for prediction risk • balance between fit & parisimony • select models that fit well without being too complex • AIC = -2*log-likelihood + 2*number of parameters • BIC = -2*log-likelihood + number of parameters * number of observations
System: Best-first Search • an informed graph search algorithm guided by a heuristic • Heurisitcs – AIC, BIC • Start from an existing model
System: Best-first Search • an informed graph search algorithm guided by a heuristic • Heurisitcs – AIC, BIC • Start from an existing model
System: Best-first Search • an informed graph search algorithm guided by a heuristic • Heurisitcs – AIC, BIC • Start from an existing model
System: Best-first Search • an informed graph search algorithm guided by a heuristic • Heurisitcs – AIC, BIC • Start from an existing model
System: Best-first Search • an informed graph search algorithm guided by a heuristic • Heurisitcs – AIC, BIC • Start from an existing model
System: Best-first Search • an informed graph search algorithm guided by a heuristic • Heurisitcs – AIC, BIC • Start from an existing model
Overview • Learning Factors Analysis algorithm • A Geometry Cognitive Model and Log Data • Experiments and Results
Experiment 1 • Q: How can we describe learning behavior in terms of an existing cognitive model? • A: Fit logistic regression model in equation above (slide 27) & get coefficients
Experiment 1 Higher intercept of skill -> easier skill Higher slope of skill -> faster students learn it • Results: Higher intercept of student -> student initially knew more The AIC, BIC & MAD statistics provide alternative ways to evaluate models MAD = Mean Absolute Deviation
Experiment 2 • Q: How can we improve a cognitive model? • A: Run LFA on data including factors & search through model space
Experiment 2 – Results with BIC • Splitting Compose-by-multiplication into two skills – CMarea and CMsegment, making a distinction of the geometric quantity being multiplied
Experiment 3 • Q: Will some skills be better merged than if they are separate skills? Can LFA recover some elements of original model if we search from a merged model, given difficulty factors? • A: Run LFA on the data of a merged model, and search through the model space
Experiment 3 – Merged Model • Merge some skills in the original model to remove some distinctions, add as a difficulty factors to consider • The merged model has 8 skills: • Circle-area, Circle-radius => Circle • Circle-circumference, Circle-diameter => Circle-CD • Parallelogram-area and Parallelogram-side => Parallelogram • Pentagon-area, Pentagon-side => Pentagon • Trapezoid-area, Trapezoid-base, Trapezoid-height => Trapezoid • Triangle -area, Triangle -side => Triangle • Compose-by-addition • Compose-by-multiplication • Add difficulty factor “direction”: forward vs. backward
Experiment 3 – Results • Recovered three skills (Circle, Parallelogram, Triangle) => distinctions made in the original model are necessary • Partially recovered two skills (Triangle, Trapezoid) => some original distinctions necessary, some are not • Did not recover one skill (Circle-CD) => original distinction may not be necessary • Recovered one skill (Pentagon) in a different way => Original distinction may not be as significant as distinction caused by another factor
Beyond Experiments 1-3 • Q: Can we use LFA to improve tutor curriculum by identifying over-taught or under-taught rules? • Thus adjust their contribution to curriculum length without compromising student performance • A: Combine results from experiments 1-3
Beyond Experiments 1-3 -- Results • Parallelogram-side is over taught. • high intercept (2.06), low slope (-.01). • initial success probability .94, average number of practices per student is 15 • Trapezoid-height is under taught. • low intercept (-1.55), positive slope (.27). • final success probability is .69, far away from the level of mastery, the average number of practices per student is 4. • Suggestions for curriculum improvement • Reducing the amount of practice for Parallelogram-side should save student time without compromising their performance. • More practice on Trapezoid-height is needed for students to reach mastery.
Beyond Experiments 1-3 -- Results • How about Compose-by-multiplication? With final probability .92 students seem to have mastered Compose-by-multiplication.
Beyond Experiments 1-3 -- Results • However, after split CMarea does well with final probability .96 But CMsegment has final probability only .60 and an average amount of practice less than 2 Suggestions for curriculum improvement: increase the amount of practice for CMsegment
Conclusions and Future Work • Learning Factors Analysis combines statistics, human expertise, & combinatorial search to evaluate & improve a cognitive model • System able to evaluate a model in seconds & search 100s of models in 4-5 hours • Model statistics are meaningful • Improved models are interpretable & suggest tutor improvement • Planning to use LFA for datasets from other tutors to test potential for model & tutor improvement