Download
1 / 24
280 likes | 519 Views
input. output. functions of single variables. how do you evaluate this function? how do you find the domain/range? how do you plot the function?. MAT17C – LEWIS – 04/02/12. input. output. y. output: y = f (1)= e -1 ~0.3679 a point on graph of f ( x ). x. input:

E N D
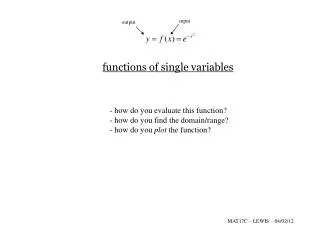
input output functions of single variables • how do you evaluate this function? • how do you find the domain/range? • how do you plot the function? MAT17C – LEWIS – 04/02/12
input output y output: y = f (1)=e-1~0.3679 a point on graph of f (x) x input: xo = 1
input output y domain = set of inputs x
input output y range = set of outputs domain = set of inputs x plot of f (x)
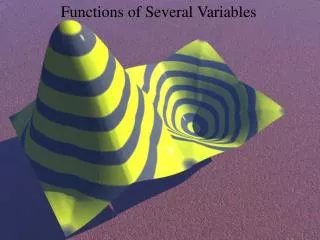
functions of two variables • how do you evaluate this function? • how do you find the domain/range? • how do you plot the function?
z a point on graph of f (x,y) output: y x input: (xo,yo) = (1,1)
z points on graph of f (x,y) y x
z range = set of outputs a point on graph of f (x,y) y x domain = set of inputs surface plot of f (x,y)
z=f (x,y) y Topographic maps plot curves of equal altitude. These curves are also called contour lines or level curves. x http://nrs.ucdavis.edu/stebbins/maps/map.htm
z level z=z*=0.5 y x
y . x level curves/contour lines for z=0.5 :
(xo,yo) = (1,1) y . x level curves/contour lines for z=z* : contour plot of f (x,y)
DOSE RESPONSE CURVE d= dose of toxin (mg) r= fraction of individuals registering the standard response (e.g., death) r d LD50 median lethal dose
DOSE RESPONSE CURVE d= dose of toxin (mg) w= weight of individual (kg) r= fraction of individuals registering the standard response (e.g., death) note: LD50= 2/3 w family of curves w=45 r w=50 w=120 w=150 d
surface plot DOSE RESPONSE CURVE
DOSE RESPONSE CURVE contour plot contour lines for r=r* :
v = activity of a neuron (Hz) (x,y) = position of stimulus on hand (or retina) • What are the level sets (contours) of f(x,y)? Draw the contour plot. • What is the change in v along contours? • What are the “shape” of the contours? • What is the “shape” of f(x,y)? • What is the shape of the function restricted to y=1? • What is the shape of the function restricted to ? • What is the rate of change of v with changes in x at(x=-1,y=1)? • What is the rate of change of v with changes in x at(x=-1,y=1)? • … what about in other directions?
RECEPTIVE FIELDS y x
RECEPTIVE FIELDS y (.. or hand) (.. or hand) x The position of a stimulus is “encoded” in the activity level of a neuron.
v y y x x surface plot contour plot (level sets)