Statistical Thinking
Statistical Thinking. Julia Horring & Pip Arnold TEAM Solutions University of Auckland. Research Project. Maxine Pfannkuch Department of Statistics The University of Auckland Statistical Thinking in preparation for NCEA 1.5 Statistics Internal.

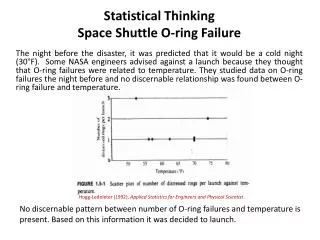
Statistical Thinking
E N D
Presentation Transcript
Statistical Thinking Julia Horring & Pip Arnold TEAM Solutions University of Auckland
Research Project • Maxine Pfannkuch Department of Statistics The University of Auckland • Statistical Thinking in preparation for NCEA 1.5 Statistics Internal. • Focus on developing a teaching programme (and teacher PD). • In class observation, video of lesson, student work, discussion.
NZ Draft Curriculum Elements of the Statistics curriculum • Data producer Understand process of statistical enquiry – PPDAC cycle Statistical investigation strand • Data consumer Critically evaluate data-based arguments in media and other sources Statistical literacy strand • Decision making under uncertainty Probability strand
Statistical investigation (thinking) • Levels 1 – 4 Conduct investigations using the statistical enquiry cycle by… • Levels 5 – 6 Plan and conduct investigations using the statistical enquiry cycle by… • Levels 7-8 Use the statistical enquiry cycle to investigate phenomena by… Make Inferences from surveys and experiments by…
Are you a Data Detective? Data Detectives use the PPDAC Cycle P Problem P Plan D Data A Analysis C Conclusion
How kids Learn – the statistical enquiry cycle 2 • Jigsaw Activity • Groups of 4. • Each person has part of the PPDAC cycle 2 1 3 3 1 4 4 2 1 3 4 1 1 1
Nosey Parker I notice…. I wonder….
Data Cards • Each card represents one person. • Easy to manipulate, sort, rearrange and even draw graphs… Gender: male Age: 12 Height: 163 cm Armspan: 163 cm Travel: walk Time: less 10 Lunch: ran I notice…. I wonder…. Gender: female Age: 12 Height: 155 cm Armspan: 155 cm Travel: walk Time: 10 - 20 Lunch: ran
4 types of questions • Summary • Relationship • Comparison • Other
Summary Questions • I wonder what the average height of these students is. • I notice that most students run around at lunchtime. • I notice that the most common way to get to school is using a motorcar.
Relationship Questions • I notice that their height is similar to their arm span. • I wonder if height has anything to do with how long it takes to get to school. • I notice that the older the students are the taller they are.
Comparison Questions • I wonder if students who walk to school take longer to get to school. • I wonder if female students are more active at lunchtime than male students. • I wonder if younger students are more active than older students. • I wonder if females are shorter than males
Other Questions • I wonder if students who went to school using a car could have used the bus. • I wonder if the older students travel further to school than the younger students. • I wonder if the results would be different for our class. • I wonder why students don’t ride bikes more.
Issues Summary Questions Most “Most students have an arm span between 150cm and 160cm” “Most students in the sample had an arm span of more than 150cm”
IssuesSummary Questions Distribution
IssuesRelationship Questions Outliers
A model Conclusion It appears that the arm span for boys and girls are similar. The median for the girls is a little higher than the median for the boys. The minimum value, LQ, UQ and the maximum value are higher for the boys than the girls, although not very much higher. The whole of the boys’ box plot appears a little higher than the girls’ box plot. The middle box of the box plots are overlapped. The data is less spread between the median and the UQ on the girls’ box plot. The data is less spread between the median and the LQ on the boys’ box plot. Overall the spread of the boys’ and girls’ data is similar. There do not appear to be any outliers or noteworthy data values. A random sampling method was used to obtain this sample. There are 10 boys and 14 girls in the sample. The difference in the group sizes does not effect the conclusion. Similar results would be expected if a new sample was taken. The subjects for this research are school age boys and girls. Based on these data values it appears that boys and girls who participated in the CensusAtSchool survey have similar arm span lengths. This finding makes sense as we would expect that school aged people would have similar arm spans. We wonder if arm spans would be different for adult females and adult males.
Critical Reflection • Consider each aspect of the PPDAC Cycle. Problem Conclusion Plan Analysis Data
Big ideas for statistical enquiry • VARIATION • Considered throughout the enquiry cycle • Integrate ideas about sample representativeness and sampling variability to reason from distributions and to draw inferences from samples about populations. • Handling data • Capturing measures • Changing representations (unlocking stories in data)
Where to next? • How does our Year 9 & 10 programme support senior statistics? • How do we integrate the idea of variation into our programme? • Action Plan for change?
Getting round to the conclusion • Use your data cards to compare the armspan of boys and girls. • Write your conclusion on OHT.
IssuesRelationship Questions Predictions Based on these data values we predict that a 13 year old will have an arm span between 145 and 175cm or of 160±15cm.