Cultural Analytics: case studies (fall 2008 - spring 2009)
450 likes | 727 Views
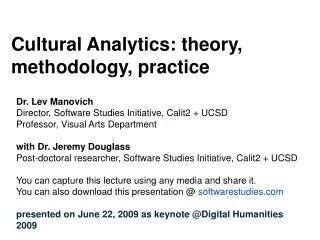
Cultural Analytics: case studies (fall 2008 - spring 2009). Dr. Lev Manovich Director, Software Studies Initiative, Calit2 + UCSD Professor, Visual Arts Department email: manovich@ucsd.edu personal web site: www.manovich.net personal blog: databeautiful.net

Cultural Analytics: case studies (fall 2008 - spring 2009)
E N D
Presentation Transcript
Cultural Analytics: case studies (fall 2008 - spring 2009) • Dr. Lev ManovichDirector, Software Studies Initiative, Calit2 + UCSD Professor, Visual Arts Department • email: manovich@ucsd.edupersonal web site: www.manovich.netpersonal blog: databeautiful.net • Software Studies Initiative: softwarestudies.comYou can also contact me on Facebook, Myspace, Flickr, and Youtube (although using manovich@ucsd.edu will result in a quicker response). • You can follow the development of Cultural Analytics at softwarestudies.com
you can find all material in this presentation at softwarestudies.com
Our research is made possible by the support from:California Institute for Telecommunication and Information (Calit2), UCSD DivisionCenter for Research in Computing and the Arts (CRCA) UCSDUCSD Visual Arts DepartmentUCDARnetUCHRINEH Office of Digital HumanitiesSingapore Ministry of Education
Software Studies Initiative Researchers:Lev Manovich | DirectorNoah Wardrip-Fruin | Associate DirectorJeremy Douglass | Postdoctoral ResearcherCicero Silva | Software Studies BrazilWilliam Huber | Researcher | PhD student, UCSDChanda Carey | Researcher | PhD student, UCSDDaniel Rehn | Researcher | MFA student, UCSD
Software Studies Initiative Collaborators:Yuri Tsivian, Department of Art History, University of Chicago: cinemetrics.lv | film analysisAdele Eisenstein: Digital Formalism project (Department for Theatre, Film and Media Studies (TFM), Vienna University; the Austrian Film Museum; Interactive Media Systems Group, Vienna University of Technology) | film analysisIsabel Galhano Rodrigues, University of Porto, Portugal | gesture analysisDavid Kirsh, Cognitive Science, UCSD | dance video analysisJim Hollan, Cognitive Science, UCSD | visualization | cultural analytics softwareFalko Kuester, Structural Engineering, UCSD + Calit2 | visualization | cultural analytics softwareYoav Freund, Computer Science and Engineering, UCSD | machine vision | cultural analytics softwareKay O’Halloran, Multimodal Analysis Lab, National University of Singapore | Mapping Asian Cultures projectGiorgos Cheliotis: Communication and New Media, National University of Singapore | Mapping Asian Cultures projectMatthew Fuller: Goldsmiths College, University of London | software studiesBenjamin H. Bratton: Visual Arts, UCSD + Calit2 | software studies
MICRO view - visual artdata: 25 canonical paintings representing transition from realism to modernism,1849-1916
MICRO view - visual artdata: 165 paintings by Mark Rothko, 1934-1970
MICRO view - video gamesdata: screen capture of a game session. game: “Knights of the Old Republic”
MICRO view - time-based mediadata: cartoons, music videos, motion graphics, films.
Comparative visualization: Betty Boop cartoon (left) vs. music videos (center and right)
Comparative visualization: Betty Boob cartoon (top) vs. music videos (center and bottom). X axis = time. Y axis = brightness mean.
MICRO view - feature filmdata: Dziga Vertov, A Man With a Movie Camera (1929. video file: archive.org
distribution of particular shot type over time. Each bar corresponds to one shot. Bar height = shot length.
Distribution of shot types over time. Bar width = shot length. Top: whole film. Bottom: close-up of the visualization.
Distribution of shot types over time. Left: close-up of the visualization. Top: larger view (part of the film)
Is a shot the most important unit of a film? X axis = time. Y axis = brightness mean. Vertical bar = shot boundaries.
MACRO view - cinemadata: average shot length stats on 1100+ feature films from cinemetrics.lv
MACRO view - televisiondata: major USA TV network news. 2 shows per year, 1960-2008.