LA HIGHWAY 1
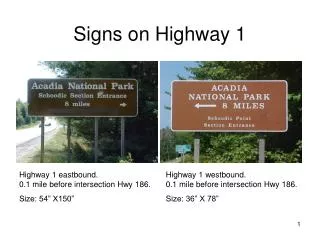
LA HIGHWAY 1. Values and Vulnerabilities. 2011 Update illustrating the Frequency of Inundation over Louisiana Highway 1 between Golden Meadow and Leeville, LA. Illustrations calculated by NOAA Highway Elevations data by Dr. Roy Dokka.

LA HIGHWAY 1
E N D
Presentation Transcript
LA HIGHWAY 1 Values and Vulnerabilities
2011 Update illustrating the Frequency of Inundation over Louisiana Highway 1between Golden Meadow and Leeville, LA Illustrations calculated by NOAA Highway Elevations data by Dr. Roy Dokka
LA 1 is relied upon for State-of-the-art infrastructure efficiently servicing the GOM
Existing Deepwater Structures in GOM:90% are serviced by Port Fourchon!
LA 1 is relied upon to service thousands of miles of GOM Pipelines
LOOP – America’s only Deepwater Oil Port capable of handling VLCC’s
LA 1 is the National Poster Child of Critical At-Risk Energy Infrastructure
3 Week Loss of Services of Port Fourchon National Economic Impacts: • $9.9 Billion in Sales Loss * • $2.9 Billion in Household Earnings Loss • $77,440 Jobs Loss Nationally • * Based on $66/barrel Oil Source: The economic impacts of Port Fourchon on the National and Houma MSA Economies. PREPARED BY: LOREN C SCOTT & ASSOCIATES, February 2008.
Leeville, LA NOAA Tide Station Bench Mark Elevation Relationship to Tidal and Geodetic Datums using data from 1987-1990 “5%” Elevation of LA-1 (Golden Meadow to Leeville) 1.56m Highest observed water level 3/23/1987 1.53m Bench Mark “8762084 B 1986” 1.24m Elevation difference 0.03m Mean Higher High Water (MHHW) 1.21m Elevation difference 0.78m Local Mean Sea Level (MSL) 1.08m Mean Lower Low Water (MLLW) 0.94m Estimated NAVD88 (1993) 0.78m Leeville Station Datum 0.00m Tidal Datum Elevations based on 1983-2001 Modified National Tidal Datum Epoch (2002-2006 MSL) NAVD88 (1993) no longer published; LA-1 Average NAVD88 Elevation from Mallory (2011) (Note: There is a high degree of uncertainty in NAVD88 elevations due to ongoing subsidence) NOAA 2/2011
The elevation of LA-1 will become increasingly inundated even if the present day relative sea level rise (RSLR) remains constant in the future. Note: NAVD88 elevations for bench marks and for LIDAR elevations for road surface are only estimates and have significant uncertainty
“5%” Elevation of LA-1 Leeville to Golden Meadow “5%” Elevation of LA-1 Leeville to Golden Meadow