Download
1 / 9
90 likes | 249 Views
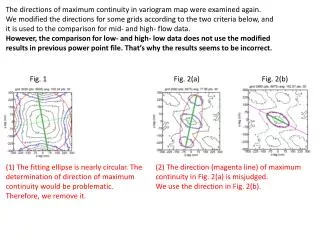
The directions of maximum continuity in variogram map were examined again. We modified the directions for some grids according to the two criteria below, and it is used to the comparison for mid- and high- flow data.

E N D
The directions of maximum continuity in variogram map were examined again. We modified the directions for some grids according to the two criteria below, and it is used to the comparison for mid- and high- flow data. However, the comparison for low- and high- low data does not use the modified results in previous power point file. That’s why the results seems to be incorrect. Fig. 1 Fig. 2(a) Fig. 2(b) (1) The fitting ellipse is nearly circular. The determination of direction of maximum continuity would be problematic. Therefore,we remove it. (2) The direction (magenta line) of maximum continuity in Fig. 2(a) is misjudged. We use the direction in Fig. 2(b).
In right figure, only low- and high- flow data are used. The red line will be chosen. In left figure, only mid- and high- flow data are used. Thus, the blue line will be chosen. red: low-flowwater green: mid-flow water blue: high-flow water black: variogram map (θ1 = 5°, θ2 = 35°) (θ1 = 5°, θ2 = 35°)
β ϒ black line: direction estimated from variogram maps red line: direction calculated from Qx/Qy at low flow green line: direction calculated from Qx/Qy at medium flow blue line: direction calculated from Qx/Qy at high flow αis the ABSOLUTE angle between blackandredlines. βis the ABSOLUTE angle between blackandgreenlines ϒis the ABSOLUTE angle between blackand blue lines. α
For each grid, the differences α, β and ϒ are evaluated. 1. The α, β and ϒ values need to be less than θ2 to be valid. 2. α and βare considered the same if their difference is less than θ1. α and ϒare considered the same if their difference is less than θ1. β and ϒare considered the same if their difference is less than θ1. 3. If θ1 <α,β,ϒ< θ2, the min(α,β,ϒ) is chosen, and plotted on the map. 4. If α,β,ϒ>θ2, all available data (vgm map data, low- , mid-, and high- flow data) are plotted on the map. For each 6m x 6m cell with vgm result Check flow data availability Only high-flow available Both low- and high-flow available no If β < θ2 Check the magnitude of αand β yes α< θ2 and β < θ2 α< θ2 and β>θ2 α >θ2 and β < θ2 no If |α- β| >θ1 yes α >θ2 and β>θ2 If α< β Drawings: no yes Draw (type I) High-flow as blue Draw (type I) High-flow as blue Draw (type I) High-flow as blue Type I Type II Draw (type II) Low-flow as red Draw (type II) Low-flow as red Draw (type III) High-flow as blue Vgm as black Type III Draw (type IV) Low-flow as red High-flow as blue Type IV Draw (type V) Low-flow as red High-flow as blue Vgm as black Type V
After the above criteria were applied, we remove the grids which have vegetation presence. The extent of each grid are adjusted to 7m × 7m. If the area of the vegetation in the grid exceeds 1 m2, the grid is removed.
All the contours are 0.5 m interval. red: low-flowwater green: mid-flow water blue: high-flow water black: variogram map Area A (θ1 = 5°, θ2 = 35°) good matches for mid-flow data perfect matches for low-, mid-, and high-flow data
red: low-flowwater green: mid-flow water blue: high-flow water black: variogram map Area B good matches for high-flow data (θ1 = 5°, θ2 = 35°) good matches for mid-flow data good matches for low-flow data
red: low-flowwater green: mid-flow water blue: high-flow water black: variogram map Area C (θ1 = 5°, θ2 = 35°)
red: low-flowwater green: mid-flow water blue: high-flow water black: variogram map Area D (θ1 = 5°, θ2 = 35°) good matches for high-flow data good matches for mid-flow data good matches for low-flow data