Download
1 / 46
460 likes | 542 Views
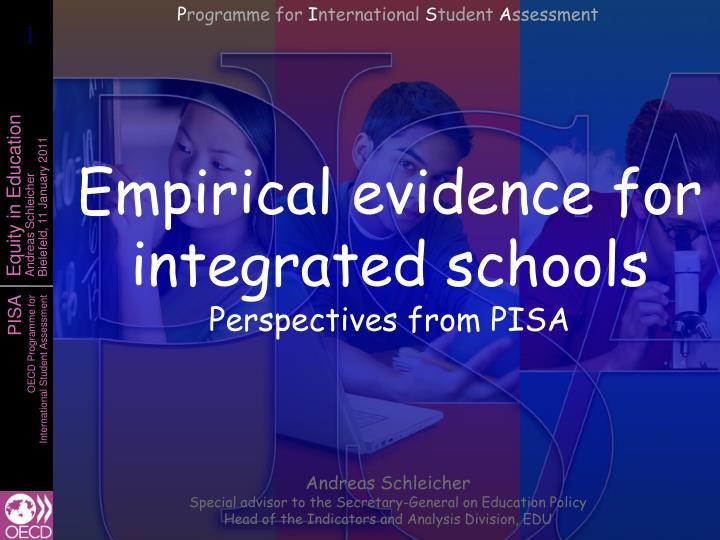
P rogramme for I nternational S tudent A ssessment. Empirical evidence for integrated schools Perspectives from PISA. Andreas Schleicher Special advisor to the Secretary-General on Education Policy Head of the Indicators and Analysis Division, EDU. Student learning. Tools Standards

E N D
Programme for International Student Assessment Empirical evidence for integrated schoolsPerspectives from PISA Andreas Schleicher Special advisor to the Secretary-General on Education Policy Head of the Indicators and Analysis Division, EDU
Student learning Tools Standards Curricula Technology Assessments Data systems Processes Selection Preparation Recruitment/induction Work organisation Development Supervision Retention People TeachersPrincipals Support personnel Families Practices Instruction Intervention Support systems Design, implementation and alignment of policies
PISA 2009 in brief PISA countries in 2003 2000 2001 2006 2009 1998 Coverage of world economy 83% 77% 81% 85% 86% 87% • Over half a million students… • representing 28 million 15-year-olds in 74* countries/economies … took an internationally agreed 2-hour test… • Goes beyond testing whether students can reproduce what they were taught… … to assess students’ capacity to extrapolate from what they know and creatively apply their knowledge in novel situations … and responded to questions on… • their personal background, their schools and their engagement with learning and school • Parents, principals and system leaders provided data on… • school policies, practices, resources and institutional factors that help explain performance differences . * Data for Costa Rica, Georgia, India, Malaysia, Malta, Mauritius, Venezuela and Vietnam will be published in December 2011
How the demand for skills has changedEconomy-wide measures of routine and non-routine task input (US) Mean task input as percentiles of the 1960 task distribution The dilemma of schools: The skills that are easiest to teach and test are also the ones that are easiest to digitise, automate and outsource (Levy and Murnane)
High reading performance Average performanceof 15-year-olds in reading – extrapolate and apply … 17 countries perform below this line Low reading performance
High reading performance Average performanceof 15-year-olds in science – extrapolate and apply High average performance Large socio-economic disparities High average performance High social equity Strong socio-economic impact on student performance Socially equitable distribution of learning opportunities Low average performance Large socio-economic disparities Low average performance High social equity Low reading performance
High reading performance 2009 Durchschnittliche Schülerleistungen im Bereich Mathematik High average performance Large socio-economic disparities High average performance High social equity Strong socio-economic impact on student performance Socially equitable distribution of learning opportunities Low average performance Large socio-economic disparities Low average performance High social equity Low reading performance
High reading performance 2009 Durchschnittliche Schülerleistungen im Bereich Mathematik High average performance Large socio-economic disparities High average performance High social equity Strong socio-economic impact on student performance Socially equitable distribution of learning opportunities Low average performance Large socio-economic disparities Low average performance High social equity Low reading performance
High reading performance 2000 Durchschnittliche Schülerleistungen im Bereich Mathematik High average performance Large socio-economic disparities High average performance High social equity Strong socio-economic impact on student performance Socially equitable distribution of learning opportunities Low average performance Large socio-economic disparities Low average performance High social equity Low reading performance
High reading performance 2000 Durchschnittliche Schülerleistungen im Bereich Mathematik High average performance Large socio-economic disparities High average performance High social equity Strong socio-economic impact on student performance Socially equitable distribution of learning opportunities Other rapid improvers in reading: Peru, Indonesia, Latvia, Israel and Brazil Rapid improvers in mathematics: Mexico, Brazil, Turkey, Greece, Portugal, Italy and Germany Rapid improvers in science: Qatar, Turkey, Portugal, Korea, Brazil, Colombia, Italy, Norway, United States, Poland Low average performance Large socio-economic disparities Low average performance High social equity Low reading performance
Student performance PISA Index of socio-economic background Disadvantage Advantage School performance and socio-economic background Germany School performance and students’ socio-economic background within schools Student performance and schools’ socio-economic background Private school Public school in rural area Public school in urban area 700 493 200
Student performance PISA Index of socio-economic background Disadvantage Advantage School performance and socio-economic background Finland Student performance and students’ socio-economic background School performance and schools’ socio-economic background Private school Public school in rural area Public school in urban area Student performance and students’ socio-economic background within schools 700
Variability in student performance between and within schools Variance Performance differences between schools Performance variation of students within schools
Does a more unequal society necessarily imply a more inequitable education system ?
Impact of social background on learning outcomes within schools between schools
Difference between observed and predicted performance in disadvantabed schools, by students’ socio-economic background Disadvantaged students Advantaged students
Difference between observed and predicted performance in mixed schools, by students’ socio-economic background Disadvantaged students Advantaged students
Difference between observed and predicted performance in advantaged schools, by students’ socio-economic background Advantaged students Disadvantaged students
Percentage of resilient students among disadvantaged students % Resilient student: Comes from the bottom quarter of the socially most disadvantaged students but performs among the top quarter of students internationally (after accounting for social background) Less than 15% resilient students among disadvantaged students More than 30% resilient students among disadvantaged students Between 15%-30% of resilient students among disadvantaged students
Increased likelihood of postsec. particip. at age 19/21 associated with PISA reading proficiency at age 15 (Canada)after accounting for school engagement, gender, mother tongue, place of residence, parental, education and family income (reference group PISA Level 1) Odds ratiohigher education entry School marks at age 15 PISA performance at age 15
A commitment to education and the belief that competencies can be learned and therefore all children can achieve • Universal educational standards and personalisation as the approach to heterogeneity in the student body… • … as opposed to a belief that students have different destinations to be met with different expectations, and selection/stratification as the approach to heterogeneity • Clear articulation who is responsible for ensuring student success and to whom Lessons from PISA on successful education systems
High reading performance 2009 Durchschnittliche Schülerleistungen im Bereich Mathematik High average performance Large socio-economic disparities High average performance High social equity Strong socio-economic impact on student performance Socially equitable distribution of learning opportunities • Early selection and institutional differentiation • High degree of stratification • Low degree of stratification Low average performance Large socio-economic disparities Low average performance High social equity Low reading performance
Clear ambitious goals that are shared across the system and aligned with high stakes gateways and instructional systems • Well established delivery chain through which curricular goals translate into instructional systems, instructional practices and student learning (intended, implemented and achieved) • High level of metacognitive content of instruction Lessons from PISA on successful education systems
Capacity at the point of delivery • Attracting, developing and retaining high quality teachers and school leaders and a work organisation in which they can use their potential • Instructional leadership and human resource management in schools • Keeping teaching an attractive profession • System-wide career development Lessons from PISA on successful education systems
How teachers are developed in serviceand supported • No matter how good the pre-service education for teachers is • …it cannot prepare teachers for rapidly changing challenges throughout their careers • High-performing systems rely on ongoing professional to… • …update individuals’ knowledge of a subject in light of recent advances • …update skills and approaches in light of new teaching techniques, new circumstances, and new research • …enable teachers to apply changes made to curricula or teaching practice • …enable schools to develop and apply new strategies concerning the curriculum and teaching practice • …exchange information and expertise among teachers and others • …help weaker teachers become more effective . • Effective professional development is on-going… • …includes training, practice and feedback, and adequate time and follow-up support
Percentage of teachers without mentoring and induction Source: OECD, TALIS Table 3.6 (Fig 2.1 Building a High-Quality Teaching Profession)
Relatively few teachers participate in the kinds of professional development which they find has the largest impact on their work Comparison of teachers participating in professional development activities and teachers reporting moderate or high level impact by types of activity
Relatively few teachers participate in the kinds of professional development which they find has the largest impact on their work Comparison of teachers participating in professional development activities and teachers reporting moderate or high level impact by types of activity
Teacher demand for professional development is often not met, sometimes for lack of time, sometimes for lack of opportunity Among those teachers who wanted more development than they received (TALIS averages) Source: OECD, TALIS Table 3.7 (Fig 2.3 Building a High-Quality Teaching Profession)
It’s not just about more of the same For what type of professional development do teachers report a high level of need?
Country profiles of cooperation among staff Country mean of ipsative scores Countries are ranked in ascending order of the degree to which teachers engage in exchange and coordination for teaching more than professional collaboration. For example, for teachers in the Slovak Republic both types of cooperation are reported almost equally frequently, while teachers in Spain report a more common practice of exchange and coordination for teaching over professional collaboration. Source: OECD, TALIS Database.
Some teachers are left aloneTeachers who received no appraisal or feedback and teachers in schools that had no school evaluation in the previous five years
How teachers are evaluated and compensated • Criteria used to evaluate teachers include… • …teacher qualifications, including teacher credentials, years of service, degrees, certifications and relevant professional development • …how teachers operate in the classroom setting, including attitudes, expectations and personal characteristics, as well as strategies, methods and actions employed in their interaction with students; and • …measures of teacher effectiveness, based on assessment of how teachers contribute to students’ learning outcomes as well as their knowledge of their field and pedagogical practice • In most countries, teachers value appraisal and feedback highly… • …and report that it improves their job satisfaction and personal development, widens their repertoire of pedagogical practices and improves their effectiveness. • In many countries, appraisal and feedback have limited impact… • …on public recognition, professional development, careers and pay.
Incentives, accountability, knowledge management • Aligned incentive structures • Forstudents • How gateways affect the strength, direction, clarity and nature of the incentives operating on students at each stage of their education • Degree to which students have incentives to take tough courses and study hard • Opportunity costs for staying in school and performing well • For teachers • Make innovations in pedagogy and/or organisation • Improve their own performance and the performance of their colleagues • Pursue professional development opportunities that lead to stronger pedagogical practices • A balance between vertical and lateral accountability • Effective instruments to manage and share knowledge and spread innovation – communication within the system and with stakeholders around it • A capable centre with authority and legitimacy to act Lessons from PISA on successful education systems
School autonomy, accountability and student performanceImpact of school autonomy on performance in systems with and without accountability arrangements PISA score in reading
Public and private schools % Score point difference Private schools perform better Public schools perform better
Lessons from PISA on successful education systems • Investing resources where they can make most of a difference • Alignment of resources with key challenges (e.g. attracting the most talented teachers to the most challenging classrooms) • Effective spending choices that prioritise high quality teachers over smaller classes
A learning system • An outward orientation of the system to keep the system learning, international benchmarks as the ‘eyes’ and ‘ears’ of the system • Recognising challenges and potential future threats to current success, learning from them, designing responses and implementing these Lessons from PISA on successful education systems
Coherence of policies and practices • Alignment of policies across all aspects of the system • Coherence of policies over sustained periods of time • Consistency of implementation • Fidelity of implementation (without excessive control) Lessons from PISA on successful education systems
The old bureaucratic system The modern enabling system Student inclusion Some students learn at high levels All students need to learn at high levels Curriculum, instruction and assessment Routine cognitive skills, rote learning Learning to learn, complex ways of thinking, ways of working Education reform trajectories Teacher quality Few years more than secondary High-level professional knowledge workers Work organisation ‘Tayloristic’, hierarchical Flat, collegial Accountability Primarily to authorities Primarily to peers and stakeholders
Thank you ! Find out more about PISA at… OECD www.pisa.oecd.org All national and international publications The complete micro-level database U.S. White House www.data.gov Email: Andreas.Schleicher@OECD.org … and remember: Without data, you are just another person with an opinion