Download
1 / 24
250 likes | 1.06k Views
David Andrzejewski, Univ. of Wisconsin-Madison (USA) David G. Stork, Ricoh Innovations, Inc. and Stanford Univ. (USA) Xiaojin Zhu, Univ. of Wisconsin-Madison (USA) Ron Spronk, Queen's Univ. (Canada)

E N D
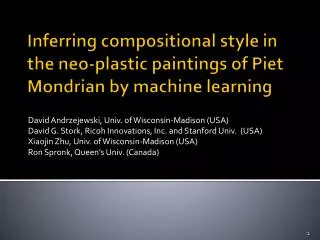
David Andrzejewski, Univ. of Wisconsin-Madison (USA) David G. Stork, Ricoh Innovations, Inc. and Stanford Univ. (USA) Xiaojin Zhu, Univ. of Wisconsin-Madison (USA) Ron Spronk, Queen's Univ. (Canada) Inferring compositional style in the neo-plastic paintings of Piet Mondrian by machine learning
Stylometry: mathematics of “style” • Visual arts • Digital authentication of Bruegel, Perugino (Lyu et al, 2004) • Jackson Pollock(Taylor, 1999)(Irfan and Stork, 2009) • Writings • Authorship of the Federalist Papers(Mosteller and Wallace, 1964) • Ronald Reagan’s radio addresses (Airoldi et al, 2007)
Piet Mondrian (1872-1944)Avond (Evening); Red Tree (1908) http://www.artchive.comHaags Gemeentemuseum, The Hague
Goal of this work • Better understand compositional style • Develop a formal representation of the paintings • Extract these representations from paintings • Train a generative model • Learn relative visual weights of colors • Classify true Mondrians versus • “fakes” created by the generative model in step 3 • “earlier states” of the Transatlantic paintings
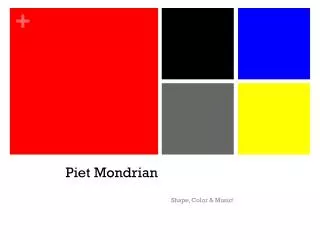
Simplified representation • Vertical/horizontal lines • locations • extents • Rectangles • locations • sizes • colors • can span multiple lines
Generative modeling • Hypothesize an underlying probabilistic model that generates observed data • Many uses in machine learning • Make predictions (Naïve Bayes) • Generate new examples (Markov model) • Interpret parameter values (Linear regression) • Given data, learn/train model parameters • Our approach: Maximum likelihood estimation (MLE)
Our generative model Canvas aspect ratios (kernel density estimator)
Our generative model Number of horiz/vert lines (Poisson) Horiz/vert line spacing (Dirichlet)
Our generative model Segments are deleted / invisible / left alone (Polya)
Our generative model Rectangle colors (Multinomial)
Additional constraints Don’t allow unrealistic “hanging” lines Require ≥ 1 vertical line
Learning color weights • Calculate visual “center of mass” • Assume true Mondrians centered at [0.5,0.5] • Learn color weights via linear programming
The Transatlantic paintings • Completed in Europe, but then altered after Mondrian’s arrival in the United States • A variety of techniques (x-ray, UV, etc) were used to recover the earlier states (Cooper & Spronk, 2001 )
The Transatlantic paintings Composition with Red, Blue, and Yellow (1937-1942)
The Transatlantic paintings Composition with Red, Yellow, and Blue (1935-1942)
The Transatlantic paintings No. 9 (1939-1942)
Decision tree classification • Very popular technique in machine learning • At each iteration, choose a rule to “split” on • Resulting partitions should be more “pure” with respect to target classification (true Mondrian or computer-generated fake?) • Key feature: resulting trees easy to interpret • Estimate accuracy with leave-one-out cross-validation • Control over-fitting with pruning
Decision tree classification • 45 true Mondrians versus 45 generated “fakes” • 45 true Mondrians versus 11 “earlier states”
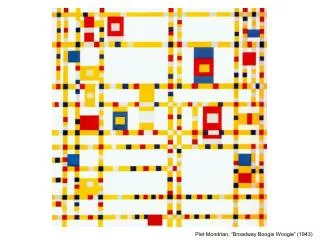
Example learned decision tree • Transatlantic dataset • < 1% pixels blue • # horiz / # vert < 0.9 • Low visual “density” • THEN Transatlantic • Analysis of results
Summary • Formal representation and feature extraction • Generative model • Fitting simple statistics of Mondrians cannot create realistic synthetic paintings • Color weights align well with our intuitions • Classification • Can reliably discriminate true Mondrians vs. computer-generated • Cannot do so for true Mondrians vs Transatlantic “earlier states” • Underlying images were “nearly complete” (!)