Download
1 / 29
300 likes | 430 Views
This guide explores the use of correlated and independent t-tests through a sample experiment focusing on male Betta splendens' gill flare duration when exposed to bright light. It includes a detailed comparison of hypotheses, methodologies, and statistical reporting using the VassarStats web-based stats program. Users will learn to graph means and standard deviations, understand the appropriate application of one-tailed t-tests, and correctly report statistical results. This is a valuable resource for anyone looking to enhance their understanding of statistical methods in biological research.

E N D
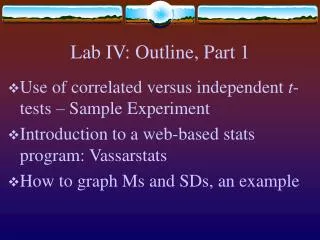
Lab IV: Outline, Part 1 • Use of correlated versus independent t-tests – Sample Experiment • Introduction to a web-based stats program: Vassarstats • How to graph Ms and SDs, an example
The Terrible t’s Independent and Correlated (Paired) t-tests
I pity the fool who doesn’t know when to use correlated vs. independent t-tests!
Sample Experiment: t-test Examples • Hypothesis 1: Exposure to bright light will increase gill flare in male Betta splendens. • Hypothesis 2: Male Betta splendens exposed to bright light will have longer gill flare durations than those not exposed to bright light.
Sample Experiment: t-test Examples • Subjects: 4 adult male Betta splendens (A, B, C, D) A
B D A C Exposed fish to each other for 10 min, recorded gill flare Trial 1
Trial 1 Gill Flare (/10 min.) = baseline duration of gill flare
Exposed Fish A & Fish C to bright light for 5 min. (no light) (no light) B D C A
B D A C Exposed fish to each other for 10 min, recorded gill flare Trial 2
Trial 2 Gill Flare (/10 min.) = duration of gill flare after light/no light
Fish No Light (Before) Light (After) A 100 s 200 s C 90 s 185 s Hypothesis 1: Exposure to bright light will increase gill flare in male Betta splendens. *We want to compare each fish’s score on one condition (“before exposure”) to its score on another condition (“after exposure”)
Fish No Light (Before) Light (After) A 100 s 200 s C 90 s 185 s Correlated (or Paired) t-test • Scores between conditions are for same subject • i.e., Fish A has a score for both “light” and “no light”, and Fish B has a score for both conditions • Hence, scores are said to be “paired” or “correlated”)
t-tests and procedures How to use Vassarstats for t-tests • http://faculty.vassar.edu/lowry/VassarStats.html
Row 1 = Fish A’s scores Row 2 = Fish C’s scores Xa = before light exposure Xb = after light exposure
Because our hypothesis was unidirectional (meaning we predicted change in a single, specific direction), we can use the one-tailed value.
How to Report Results: Examples • “Exposure to bright light significantly increases gill flare duration in male Betta splendens(t = -39, df = 1, p < .05) .” Must also include Ms and SDs in a table or graph. • “Gill flare duration after light exposure (M = 192.5, SD = 10.61) was significantly greater than before light exposure (M = 92.5, SD = 7.07); t(1) = -39, p < .05.”
Subject Light Subject No Light A 200 s B 130 s C 185 s D 125 s Hypothesis 2: Male Betta splendens exposed to bright light will have longer gill flare durations than those not exposed to bright light. *Across conditions, we are comparing the scores of two different fish; hence, the scores are independent of each other
Subject Light Subject No Light A 200 s B 130 s C 185 s D 125 s Independent t-test • The scores between the two conditions are from different subjects, which makes them independent • The scores in the “Light” condition are not correlated with scores in the “no light” condition
How many scores are in each column? (If unequal, pick larger.) 2
Xa = Light Xb = No Light
How to Report Results: Examples • “Male Betta splendens that were exposed to bright light (M = 192.5, SD = 10.61) flared their gills for longer durations than those not exposed to bright light (M = 127.5, SD = 3.54);t(2) = 8.22, p < .05.” • Or, can give Ms and SDs in a table or graph.
HINT: The columns correspond to those used for your t-test… SD for C2 SD for C1 Mean for C2 Mean for C1