Download
1 / 16
160 likes | 311 Views
Normal CSF Flow Measurements at the Aqueduct Performed at 3T. E. Kapsalaki, I. Tsougos, P. Svolou, E. Dardiotis, G. Hadjigeorgiou, K.N. Fountas University Hospital of Larissa Depts of Radiology, Physics, Neurology and Neurosurgery. XIX Symposium Neuroradiologicum, Bologna 2010. Introduction.

E N D
Normal CSF Flow Measurements at the Aqueduct Performed at 3T E. Kapsalaki, I. Tsougos, P. Svolou, E. Dardiotis, G. Hadjigeorgiou, K.N. Fountas University Hospital of Larissa Depts of Radiology, Physics, Neurology and Neurosurgery XIX Symposium Neuroradiologicum, Bologna 2010
Introduction • Accurate knowledge of normal CSF flow through the aqueduct is important in decision making in patients with hydrocephalus • Purpose: • Evaluate normal CSF flow measurements at 3T in healthy volunteers and compare with 1,5T. • Estimation of user dependency with variation of Region-Of-Interest analysis.
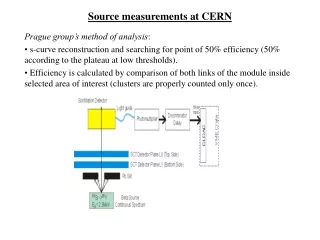
Material and Methods • 15 healthy volunteers aged 15-43 yo (mean age 24.6 years) • 3Τ HDxT, GE MR system (GE Medical Systems, Milwaukee, USA). • Phase Contrast cine MRI • Cardiac gated, flow compensated, gradient echo sequences (flow encoding 10cm/sec). • Measurements performed on sagittal Τ1 • ROI analysis at three levels of the aqueduct • ROIs of variable size were concentrically placed to evaluate user dependent variation • Analysis performed on software provided • PPV, PNV and AF were evaluated
Material and Methods Cerebral aqueduct is divided anatomically into three parts, separated by two natural constrictions of the aqueductal lumen, one in the middle of the superior colliculus (A) and the other at the level of the intercolliculars sulcus (B) forming the • upper part - pars anterior or inlet, • middle part - ampulla and • inferior part – pars posterior Lee et al. Korean J. Radiol. 2004
ROI_1= Exactly at the margins of the aqueduct ROI_2= Slightly larger than the aqueductal margins Baseline=Outside the area of the aqueduct at the midbrain separating (+) from (–) flow.
Flow quantification was carried out using the software provided by the manufacturer (GE Report Card version 3.6)
A B C
Conclusions I • ROI size • has no effect on PPV and PNV • Affects flow • PPV PNV slight decrease caudally • No significant variation between measurements of flow in the different parts of the aqueduct Normal measurements at 1.5T reported <0.044ml/sec at the ampulla Select ampulla for measurements Usually wider and better reproducibility
RESULTS AMPULLA 0.036±0.016 ml/beat Max 0.057 ml/beat Min 0.014
REFERENCES • Stoquart-ElSankari, S., O. Baledent, et al. (2007). "Aging effects on cerebral blood and cerebrospinal fluidflows." J Cereb Blood Flow Metab 27(9): 1563-72. • 19 healthy volunteers (mean age 27 years) και 12 elderly normal volunteers (m.a. 71 y) • 1.5Τ MR System (Signa; General Electric Medical System, Milwaukee, USA) • ROI measurements at the level of the ampulla and at various levels of the cervical spine
Conclusions II • ROI size affects average flow • ROI should be placed at the margins of the aqueduct in order to obtain the most accurate measurements • Normal average CSF flow at the level of the aqueduct at 3T was 0.036±0.016 ml/beat • Measurements at 3T do not show significant variability compared to measurements reported at 1.5T • Creation of database, age matched, to evaluate patients with dilated ventricular system