introducing Dependency Ratios
introducing Dependency Ratios. What's to come…. 1. 2. Impacts of youthful and aging populations. What are dependency Ratios?. 1. Dependency Ratios. Dependency ratios.


introducing Dependency Ratios
E N D
Presentation Transcript
What's to come… 1 2 Impacts of youthful and aging populations What are dependency Ratios?
1 Dependency Ratios
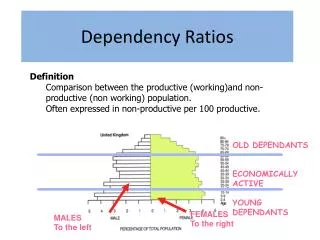
Dependency ratios • The population of a country can be divided into two categories according to their contribution to economic productivity. Those aged 15-65 years are known as the economically active or working population; those under 15 (the youth dependency ratio) and over 65 (the old age dependency ratio) are known as the non-economically active population.
Getting Startedwith dependency ratios Dependency Ratio: is the relationship between the working or economically active population and the non-working population. Youth Dependency Ratio- the ration of the number of people 0-14 to those of 15-64 years.
Elderly dependency ratio: the ratio of the number of people aged 65 and over to those aged 15-64 years.
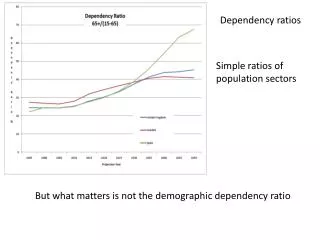
e.g. UK 1971 (figures in millions): • 13 387 + 7307 x100 = 65.45 31616 So for every 100 people of working age there were 65.45 people dependent upon them
By 1999 the dependency ratio had changed to: • 11 345 + 9 271 x 100 = 53.55 38 498 So although the number of elderly people had increased, this was more than offset by the larger drop in the number of children (the dependency ratio does not take into account those who are unemployed). The dependency ratio for most developed countries is between 50 and 70, whereas for less economically developed countries it is often over 100.
What is the dependency Ratio? Youth dependency? Elderly dependency?
Importance of dependency ratios The dependency ratio is important because the economically active population will contribute more to the economy (taxes on income, goods and business activity) The dependent population tends to be bigger recipients of government funding (education, health care, pensions). The increase in the dependency ratio can cause significant financial problems for a government if it does not have the financial reserves to cope with such change.
Limitations of the dependency ratio: • In developed countries few people leave education before the age of 18, many do not get a job until 21 and even retire before the age of 65. • A large number of people in the economically active group are staying home, such as parent to look after children and other reasons. • In developing countries many children are working full or part time before the age of 15- some areas also have high unemployment.
Video time: Watch and Learn http://www.youtube.com/watch?v=Ao3flYBgdRU
2 Impacts of a youthful or aging populations
YOUTHFUL POPULATION Lets start with:
Problems to Malawi's Youthful Population • Problems • Pressure on providing adequate medical services and health care. This may lead to widespread disease and infections • Education system under stress – lack of education leads to under-paid, under-privileged jobs. • Insufficient food supply – could lead to famine • Increased rural-urban migration as rural areas unable to sustain growing population. This could lead to shanty towns • Increased poverty and lower standards of living.
Video Clip • http://www.youtube.com/watch?v=0ukNFMeZvcc&list=FLjCw18Dzx8TViPFSvwRAInA&index=2&feature=plpp_video
Japan Case Study Japan has an ageing population because the birth rates have fallen and it has one of the world's highest life expectancy's. In fact the islands of Okinawa off Japan's south coast have the highest life expectancy and the greatest percentage of centenarians in the world. Japan has the highest proportion of old dependents (about 23%) and the lowest proportion of young dependents (about 13%) in the world. It has a total fertility rate of only 1.25. This is well below the replacement rate of 2.1. Even though the Japanese are working longer, it may have to look outside its borders to prevent future population decline and economic decline. Japan is traditionally a very insular country so allowing large scale immigration would involve huge social and cultural changes.
Causes of an Aging Population High life expectancy caused by: -Good medical care -Good diet and improved water supply -Good sanitation and hygiene Low birth rates caused by: -Emancipation of women -Cost of children -Emigration of economically active
Solutions to an Ageing Population -Pro-natalist policies -Increased immigration of economically active -Increased retirement age -Private pensions -Private healthcare -Increased taxes of economically active
Videos: Ageing Populations: Chinas- Upside down pyramid- 6 minshttp://www.economist.com/blogs/analects/2012/04/chinese-demography?fsrc=nlw%7Cnewe%7C4-23-2012%7C1479315%7C37467942%7C • Aging populations: http://www.youtube.com/watch?v=QHCt6PmSs0k