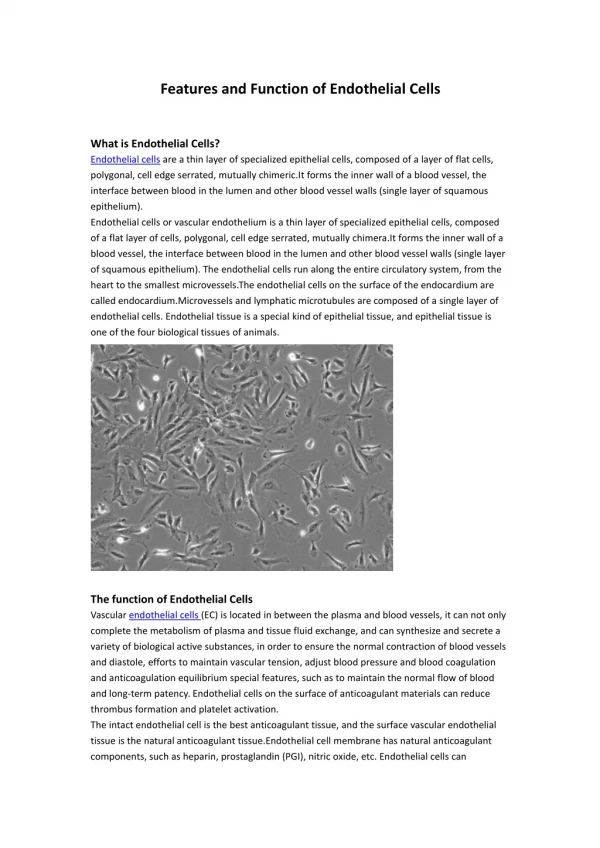
Download
1 / 32
320 likes | 349 Views
This study by Jackie Hai and Vivian Xue explores the relationship between focal distance and image distortion in specular microscopy to create a predictive model for cell counting errors. Results indicate the importance of minimizing focal deviance for accurate cell counting. Recommendations include capturing images at high resolution and adjusting focus techniques. For more information, visit http://www.hailabs.com/specular-microscopy.

E N D
Effect of Specular Focal Distanceon Endothelial Cell Counting Accuracy Jackie Hai and Vivian Xue HAI Laboratories, Inc.
Special Thanks for providing research cornea
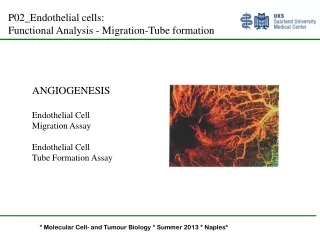
Purpose • Quantify the relationship between focal distance and image distortion in specular microscopy • Determine predictive model of cell counting error based on amount of deviance from true endothelial cell shape and size
High Resolution Analysis (640x480 pixels) Sample Area: 39981.10μm2 Cells Counted: 113 Density: 2826
High Resolution Analysis (640x480 pixels) Sample Area: 44843.25μm2 Cells Counted: 113 Density: 2520
Method • High resolution specular image of standard calibration lens • Baseline pachymetry of 0.000mm established for focused image
Calibration Lens Baseline focal distance = 0.000mm
Method • Images captured 30μm, 40μm, 50μm, 60μm, 70μm, 80μm, 90μm and 100μm from baseline focal distance • 10 sample area measurements per image (single blind trial) • Determine mean area of each image • Simple linear regression model
Conclusion Projected cell counting error
Discussion • Minimizing focal deviance is essential to capturing true area • Higher resolution images allow better judgment of focal deviance • Lower resolution images obscure focal deviance due to compression
Focal Deviance = 0.100mm 640x480 160x120
Focal Deviance = 0.060mm 640x480 160x120
Focal Deviance = 0.030mm 640x480 160x120
Focal Deviance = 0.000mm 640x480 160x120
Focal Deviance = 0.000mm 640x480
Focal Deviance = 0.030mm 640x480
Focal Deviance = 0.060mm 640x480
Focal Deviance = 0.100mm 640x480
Recommendations • Allow donor tissue to warm up to room temperature • Use both coarse and fine Z-knobs to attain optimum focus • If it is difficult to focus, change the angle of the chamber or vial
Recommendations • Capture specular images at the highest possible resolution (e.g. 640x480 pixels) • Select flat areas of endothelial cells to perform density analysis http://www.hailabs.com/specular-microscopy