Download
1 / 35
350 likes | 513 Views
Scalp distribution of Pitch-Contour Following Responses in Normal-Hearing Adults. Jiong Hu Fall 2008. Introduction -- FFR. A type of sustained brainstem neural activity that reflects the potentials integrated over a population of neural elements

E N D
Scalp distribution of Pitch-Contour Following Responses in Normal-Hearing Adults Jiong Hu Fall 2008
Introduction -- FFR • A type of sustained brainstem neural activity that reflects the potentials integrated over a population of neural elements • Has periodic peaks with intervals that correspond to the periodicity of the stimulus token. • Reveals the phase-locking activity of a population of neural elements that is to the individual cycles of the stimulus waveform and the envelope of periodic stimuli
Introduction -- FFR • Carry information about certain steady-state and time-variant acoustic features of speech sounds • Preserve information about the spectra and pitch of speech sounds • Thus, speech stimuli have been used to study the response characteristics of the FFR
Introduction -- FFR • Besides those studies in FFR to neural representations of both steady-state and time-variant stimuli, voice pitch had undergone substantial researches recently • The human FFR representation of pitch contours (pitch contour following response, PCFR)
Introduction -- PCFR Recording Montage • To date, all of the previous studies on human PCFR used only one channel recording • Multiple recording montages were used by previous researchers
Introduction -- PCFR What about the distribution on human scalp? • There are no studies aimed to examine the distribution • The best location to record PCFR? • Where is the “hot spot” on its scalp topography?
What is the scalp distribution of PCFRs in response to Mandarin tones? Research Question
Hypotheses • The scalp distribution of the PCFR will be inhomogeneous with a specific pattern. • The PCFR scalp topography will have the largest response amplitudes located at the temporal area contralateral to the stimulation site.
Specific Aims • To quantify and investigate the topographical distribution of the PCFRs on the scalp. • To determine the most promising location and recording montage to mearsure the Mandarin-tone elicited PCFRs.
Significance • PCFR provides an alternative way in examining the human brains’ ability to respond to pitch contours of speech sounds. • PCFR help us to extend our understanding on the activities of the neural elements in the brainstem area. • Help improve the test efficiency in this area.
Significance • PCFR has potential clinical relevance • PCFR test does not require the behavioral response from the participant. • PCFR could be used regardless of the subjects’ behavioral status in the test • Help carry out the test more effectively. • Help developing clinical configurations PCFR test.
Methodology-- Subjects • Twelve native speakers of Mandarin Chinese, ranging in age from 20 to 30 years • Hearing threshold greater than 20 dB HL for octave frequencies between 250 and 8000 Hz • Eyes closed and recline on a comfortable chair in an acoustically and electrically treated sound booth
Methodology-- Stimulus Presentation • One monosyllabic Mandarin Chinese syllable was prepared to contrast the lexical tone: yi2. • Recorded by a native Mandarin Chinese male speaker, with a sampling rate of 40000 samples/sec • Duration of 250 ms with a rising and falling time of 10 ms. The inter-stimulus-interval was be set to 50 ms.
Methodology-- Stimulus Presentation • LabView software written in National Instrument, delivers a trigger pulse synchronized to the onset of each stimulus token • PCI 6221 Input-output card, sampling rate of 40 kHz • Wavetek low-pass filter, TDT PA4, TDT HB6 • Custom-built electromagnetically-shielded insert earphone (Etymotics, ER-3A) • Presented monaurally to the right ear at 55 dB SPL • Two trials of 1100 repetitions for each token
Methodology-- Recording System • Twenty-one electrodes were placed on the scalp based on the modified international 10-20 recording system • Cz, Fz, Pz, Fp1, Fp2, F3, F4, C3, C4, T3, T4, P3, P4, T5, T6, O1, O2, M1, M2
Methodology-- Recording System • Mid-place between Cz and Cpz served as non-inverting • low-forehead (Fpz) served as the Ground • impedances were maintained below • Amplified through NeuroScan SynAmp2 (24 bit resolution, least significant bit: 0.15 nV) • Recorded using the NeruoScan ACQUIRE 4.3 software, bandpass filtered at 0.05–3500 Hz (6 dB/octave)
Methodology-- Data Analysis • MatLab (2007b) and EEGLab (6.0.1b) • Raw data was examined first in the NeruoScan SCAN 4.3.3 software • 100-3000 Hz band-pass filter; Segmented 0 to 30 ms • Artifact rejection criteria: • After averaging, carry out a periodicity detection short-term autocorrelation algorithm (Boersma, 1993) on the recordings • Find the major maxima in the autocorrelation function of the response, calculate the corresponding pitch strength • Pitch strength: the magnitude of the normalized autocorrelation peak that corresponds to f0 • Plot pitch strength (PCFR topography) on the scalp
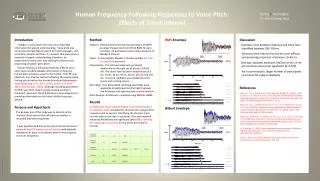
Methodology-- Data Analysis Figure 1: Spectrogram of the stimulus yi2 and a typical example of the spectrogram of the recorded PCFR (Subject #6, M2-Reference, channel F3).
Methodology-- Data Analysis • Figure 2: Spectrogram, autocorrelation function, power spectral density function and autocorrelogram of PCFR recorded from another participant (Subject #8, M2-referenced, channel T3).
Results--Scalp distribution of the PCFR • Figure 3: Autocorrelation function and spectrogram of the response from one representative participant (Subject #8), displaying M2-referenced recordings from nine electrodes on the scalp.
Results --Scalp distribution of the PCFR • Spectrograms of all the recordings sites display different response strengths. • Amplitudes of the f0 peaks in autocorrelation functions vary from site to site. • Indicates that the amplitude distribution of the PCFRs on the scalp is indeed inhomogeneous.
Results --Scalp distribution of the PCFR • Figure 4: Grand averaged topography (top panel) and individual topographies (bottom panels).
Results --Scalp distribution of the PCFR • Topographical mapping of the pitch-strength distribution of PCFRs. • Contralateral temporal area has the largest relative response amplitude. • An increase in response from central to the contralateral region. • Six out of eight participants has a topographic contour that is consistent with the grand mean.
Results--Hemispheric lateralization of the PCFR • Three offline re-references were carried out: (1) Reference to M2 (2) A site between Cz and Fz (3) An averaged reference across recording sites.
Results--Hemispheric lateralization of the PCFR • Figure 5: Autocorrelation function and spectrogram of the stimulus from one representative participant (Subject #8, Cz-Fz-Midplace-reference).
Results--Hemispheric lateralization of the PCFR • Cz-Fz-Midplace referencing • Response amplitude outcomes at temporal locations were largely reduced. • Not recommended: • Difficult to determine the existence of PCFR • Difficult to examine the difference among sites.
Results--Hemispheric lateralization of the PCFR • Figure 6: Autocorrelation function and spectrogram of the stimulus from one representative participant (Subject #8 average-reference ).
Results--Hemispheric lateralization of the PCFR • Averaged referencing • Preserve referenced channel • Introducing noise • Response amplitude outcomes at temporal locations were reduced. • Not recommended: • Difficult to determine the existence of PCFR • Difficult to examine the difference among sites.
Results--Hemispheric lateralization of the PCFR M2 Cz-Fz-Midplace Averaged
Discussion • In PCFR, the largest response amplitudes are in the contralateral temporal region, when referenced to the ipsilateral side. • In comparison: • ASSR: Most significant in averaged referencing. • ABR: Maxim response at contralateral region, when referenced to the ipsilateral side.
Discussion • PCFR is a small response • Six out of twelve participants showed similar distribution patterns to the grand average. • Long preparation process: 30 – 40 mins for two experimenters. • Discomfort participants may have larger phiological noises. • Twenty-one may be the minimum number of channels to compete a distribution on the scalp.
Discussion • Magnetic field examination vs. electric field examination. • Magnetic field examination is valid only for cortex generated responses. • Souce of PCFR is deep in the brainstem. • Further expand this study to include other stimulus sets. • Further examine the distribution of correlations of PCFR responses and the stimulus
Reference • Boersma P: Accurate short-term analysis of the fundamental frequency and the harmonics-to-noise ratio of a sampled sound. Proc Inst Phon Sci 1993;17:97-110. • Cariani PA, Delgutte B: Neural correlates of the pitch of complex tones: I. Pitch and pitch salience. J Neurophysiol 1996; 76:1698-1716. • Greenberg S, Marsh JT, Brown WS, Smith JC: Neural temporal coding of low pitch: I. Human frequency-following responses to complex tones. Hear Res 1987; 25:91-114. • Dajani HR, Purcell D, Wong W, Kunov H, Picton TW: Recording human evoked potentials that follow the pitch contour of a natural vowel. IEEE Trans Biomed Eng 2005;52:1614-1618 • Johnson KL, Nicol TG., Kraus N: Brain Stem Response to Speech: A Biological Marker of Auditory Processing. Ear & Hearing 2005;26(5):424-434. • Krishanan A: Human frequency-following response to two-tone approximations of steady-state vowels. Audiol Neurootol 1999; 4:95-103. • Krishnan A: Human frequency-following responses: Representation of steady-state synthetic vowels. Hear Res 2002; 166(1-2): 192-201 • Krishnan A, Xu Y, Gandour JT, Cariani PA: Human frequency-following responses: Representation of pitch contours in Chinese tones. Hear Res 2004; 189 (1-2):1-12. • Krishnan A, Xu Y, Gandour JT, Cariani P: Encoding of pitch in the human brainstem is sensitive to language experience. Cogn Brain Res 2005;25:161-168.
Reference • Marsh JT, Brown WS, Smith JC: Differential brainstem pathways for the conduction of auditory frequency-following responses. Electroencephalogr Clin Neurophysiol 1973;36:415-424 • Moushegian G., Rupert AL, Stillman RD: Scalp recorded early responses in man to frequencies in the speech range. Electroencephalogr Clin Neurophysiol 1973;35: 665-667. • Plyer PN, Ananthanarayan AK: Human frequency following Responses: Representation of second formant transitions in normal-hearing and hearing-impaired listeners. J Am Acad Audiol 2001;12: 423-533. • Norrix LW, Glattke TJ: Multichannel waveforms and topographic mapping of the auditory brainstem response under common stimulus and recording conditions. J Commun Disord 1996; 29(3):157-82. • Starr A, Achor J: Auditory brain stem responses in neurological disease. Arch Neurol 1975;32(11):761–768. • Swaminathan J, Krishnan A, Gandour JT: Pitch encoding in speech and nonspeech contexts in the human auditory brainstem. Neuroreport 2008;19(11):1163-1167