Download
1 / 33
330 likes | 487 Views
Agreement/discrepancies between models and observations on the large scale hydrological cycle. Richard Allan ESSC/National Centre for Earth Observation, University of Reading, UK Thanks to: Brian Soden Viju John. What do we want to predict? P-E, P, P-events; large-scale, regional

E N D
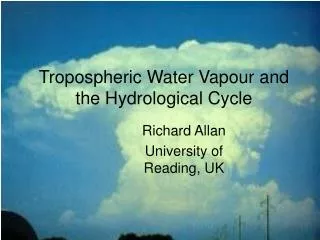
Agreement/discrepancies between models andobservations on the large scale hydrological cycle Richard Allan ESSC/National Centre for Earth Observation, University of Reading, UK Thanks to: Brian Soden Viju John
What do we want to predict? • P-E, P, P-events; large-scale, regional • For agriculture, health, infrastructure, etc • Physical constraints • Thermodynamic, dynamic • Radiation, water vapour, surface conditions • How can observations help? • Observing system; monitoring, variability
Models simulate robust response of clear-sky radiation to warming (~2 Wm-2K-1) and a resulting increase in precipitation to balance (~2 %K-1) e.g., Allen & Ingram, 2002; Lambert & Webb (2008) GRL Surface Temperature (K)
But moisture observed & predicted to increase at greater rate ~7%K-1 • Thus convective rainfall expected to increase at a faster rate than mean precipitation (e.g. Trenberth et al. 2003 BAMS) 1979-2002
Contrasting precipitation response expected Heavy rain follows moisture (~7%/K) Mean Precipitation linked to radiation balance (~3%/K) Precipitation Light Precipitation (-?%/K) Temperature e.g. see Held and Soden (2006) J. Clim
What do observations tell us? Response of Moisture and Clear-sky Longwave Radiation to warming appears robust in models and observations
…despite inaccurate mean state Left: Pierce et al. (2006) GRL; see also John and Soden (2006) GRL
Does moisture rise at 7%/K? Specific humidity trend correlation (left) and time series (right) Willett et al. (2008) J Clim LandOcean Willett et al. (2007) Nature Robust relationships globally. Less coherent relationships regionally/ over land (right)? See also Wang et al. (2008) GRL
Does extreme precipitationfollow moisture & Clausius Clapeyron?- Intensification of heaviest rainfall with warming in obs/models Allan and Soden (2008) Science
Large spread in response of heaviest precipitation to warming between models and satellite data. Changes in extreme vertical motion may be key…
Changes in Extreme Precipitation Determined by changes in low-level water vapour and updraft velocity Above: O’Gorman & Schneider (2008) J Clim Aqua planet experiment shows extreme precipitation rises with surface q, a lower rate than column water vapour Right:Gastineau and Soden, in prep: Reduced frequency of upward motion offsets extreme precipitation increases.
How are Observed Mean Precipitation and Evaporation Changing? (Wentz et al. 2007, Science) Observed responses appear larger than models and closer to Clausius Clapeyron Yu and Weller (2007) BAMS
Muted Evaporation changes in models are not explained simply by declining wind stress Simulated changes in Evaporation are sensitive to small changes in the boundary layer Richter and Xie (2008) JGR in press; also Lorenz et al. J Climate under review CC Wind Ts-To RHo
Do observations confirm contrasting precipitation responses in the wet and dry regions? : “the rich get richer” or the wet get wetter? IPCC 2007 WGI Precip trends, 0-30oN Rainy season: wetter Dry season: drier Chou et al. (2007) GRL
Contrasting precipitation response in ascending and descending portions of the tropical circulation ascent Precipitation change (mm/day) descent GPCP Models Allan and Soden (2007) GRL
Contrasting ascent/descent reponse robust • Magnitude of responses sensitive to time period/dataset ASCENT ALL DESCENT TRMM Viju John et al. in prep
Mishchenko et al. (2007) Science Could changes in aerosol be driving recent changes in the hydrological cycle? e.g. Wild et al. (2008) GRL Wielicki et al. (2002) Science; Wong et al. (2006) J. Clim; Loeb et al. (2007) J. Clim
Precipitation response depends upon forcing Andrews et al. J Climate in press:
Conclusions • Low level moisture responses robust: • Less clear over land. Inaccurate mean state? • Precipitation extremes linked to moisture • Moisture response at lowest level? Changes in updraft velocity? • Differences between individual models and observations • Mean and regional precipitation response: a tug of war • Slow rises in radiative cooling • Faster rises in low-level moisture • Wet get wetter and dry get drier • Who cares about drought/flooding over the ocean? • Recent Precipitation Responses appear larger in observations than models. • Could aerosol be influencing decadal variability in the hydrological cycle? • Are observing systems up to monitoring changes in the water cycle? • Understanding changes in near surface conditions may be important • AGU Fall meeting: GC08 Dynamic and Thermodynamic Controls of the Global Water Cycle in the 20th and 21st Centuries, Thurs 18th Dec • Future NERC projects • PREPARE project proposal
Vecchi and Soden (2006) Nature • Evidence for weakening of Walker circulation in models and observations
How should precipitation respond to climate change? Allen and Ingram (2002) Nature
Changes in precipitation: “the rich get richer”? precip trends 0-30oN Rainy season: wetter Dry season: drier Chou et al. (2007) GRL
Water vapour • Instrumental in determining amount of warming and changes in precipitation • Agreement: tropical ocean, UTH • Land? Moistening processes/cloud? • Precipitation • How should it change • Extreme precip • Regional responses • Evaporation • Sensible Heat • Aerosol
Unanswered questions • How does UTH really respond to warming? • Do we understand the upper tropospheric moistening processes? • Is moisture really constrained by Clausius Clapeyron over land? • What time-scales do feedbacks operate on? • Apparent discrepancy between observed and simulated changes in precipitation • Is the satellite data at fault? • Are aerosol changes short-circuiting the hydrological cycle? • Could model physics/resolution be inadequate? • Could subtle changes in the boundary layer be coupled with decadal swings in the hydrological cycle? • How do clouds respond to forcing and feedback including changes in water vapour?
Is moisture at higher levels constrained by Clausius Clapeyron? Trend in water vapour radiance channels: 1983-2004 Observations Model Moistening Constant RH model Constant water vapour model Soden et al. (2005) Science
What time-scales do different processes operate on? Soden et al. (2002) Science; Forster/Collins (2004) Clim Dyn; Harries/Futyan (2006) GRL
Is the mean state important? • Models appear to overestimate water vapour • Pierce et al. (2006) GRL; John and Soden (2006) GRL • But not for microwave data? [Brogniez and Pierrehumbert (2007) GRL] • This does not appear to affect feedback strength • Held and Soden (2006), John and Soden (2006) • What about the hydrological cycle? • Inaccurate mean state? Pierce et al. (2006) GRL
Reduction in UTH with warming Minschwaner et al. (2006) J Clim Lindzen (1990) BAMS Mitchell et al. (1987) QJRMS
Evaporation cannot explain moistening g m-3 350 250 180 120 90 63 45 30 John and Soden (2006) GRL; Luo and Rossow (2004)
Interanual Variability: Response of water vapour & clear-sky LW radiation at the surface and TOA in models, reanalyses & observations Water vapour Surface clear LW Clear-sky OLR