Download
1 / 34
340 likes | 419 Views
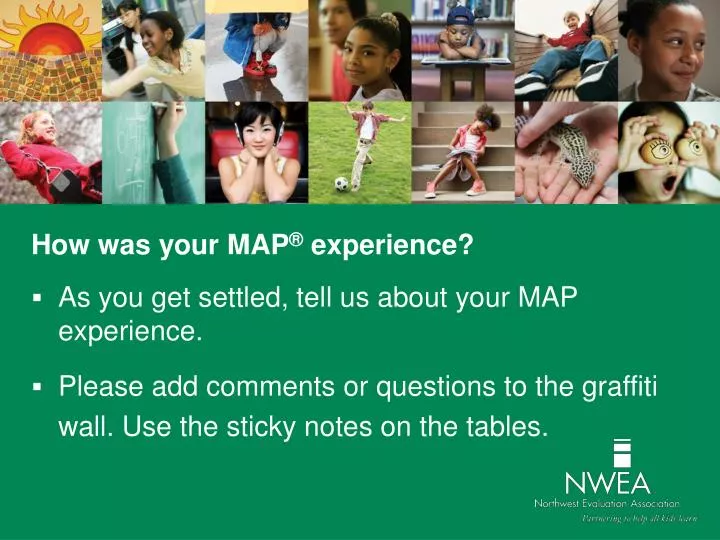
How was your MAP ® experience? As you get settled, tell us about your MAP experience. Please add comments or questions to the graffiti wall. Use the sticky notes on the tables. Stepping Stones to Using Data Web-Based MAP.

E N D
How was your MAP® experience? • As you get settled, tell us about your MAP experience. • Please add comments or questions to the graffiti wall. Use the sticky notes on the tables.
Stepping Stones to Using DataWeb-Based MAP Measures of Academic Progress, MAP, DesCartes: A Continuum of Learning, Partnering to help all kids learn, Power of Instructional Design, Power of Teaching, Power of Coaching, Keeping Learning on Track, and Learning Plans on Demand are registered trademarks of NWEA in the U.S. and in other countries. Northwest Evaluation Association, NWEA, GRD, KLT, Skills Pointer, Children’s Progress Academic Assessment, and CPAA are trademarks of NWEA in the U.S. and in other countries. Lexile® is a trademark of MetaMetrics, Inc., and is registered in the United States and abroad. The names of other companies and their products mentioned are the trademarks of their respective owners.
Setting the Stage Welcome and introductions Structure for the day Agenda
Self-Assessment DesCartes: A Continuum of Learning®/Primary Grades Instructional Data (PGID) for lesson planning and goal setting. The Class Breakdown by Goal Report for lesson planning and grouping. The Class Report to make instructional decisions. Identify strengths and areas of need using MAP data. How to access and understand growth projections for students. Set goals with my classes and students.
Activating Prior Knowledge Adaptive Assessment RIT Scale as a Growth Measure Normative Data Instructional Readiness DesCartes: A Continuum of Learning Primary Grades Instructional Data
Class Report Displays the teacher’s class data for the current testing term, by RIT score
Standard Deviation • Smaller standard deviations indicate that students are more alike. • How might this impact instruction? Larger standard deviation indicates more academic diversity How might this impact instruction?
Class Breakdown by RIT Reports Displays the teacher’s class data by subject and horizontally by RIT for current test term.
Class Breakdown Reports and DesCartes: A Continuum of Learning®
Connecting Data to Instruction Identify a Standard/Concept Identify related goal area Find overall RIT range for class Locate the middle range Identify the ranges above and below Choose 2-3 statements for each range Identify activities/strategies to target skills and determine assessment to measure success
Growth Norms Bring Context to the Data Glennisha: RIT 198 Hunter: RIT 227 • Physical Growth vs. Academic Growth • Typical Growth • Normative Data • Growth Projections
Achievement Status and Growth Reports • Projection Report • Available after the first testing season • Shows realistic growth projections for all students in a class • Summary Report • Available after the second testing season • Displays data relative to the growth projections for each student
Growth in Context • RIT Scale School Norms User’s Guide • The NWEA Research Team has enhanced the RIT Scale School Norms User’s Guide, which has more depth than the former School Growth Study. • The guide looks at district-level RIT scores and distributions. This added informative data for school and grade-levels will help you compare your performance to other schools around the country. • In addition to the RIT Scale School Norms User’s Guide, a calculator for accessing searchable data points within the tables and a short instructional video are available for your use. To access these resources, go to NWEA.org/schoolnormsstudy.
Student Goal Setting Student Class Grade level School District
Student Progress Reports Displays student’s overall progress in historical terms and includes comparisons to district average and NWEA norm group average. In text and graphical format.
Sharing Results • Students • Student Progress Report • Student Goal Setting Worksheet • With individual students • As a class activity • Parents • Student Progress Report • Student Goal Setting Worksheet • DesCartes/Primary Grades Instructional Data
Possible Parent Questions Has my child’s score gone up? Is my child performing at gradelevel? Based on these scores, how and what will you teach my child in class? What do the percentiles mean?
Planning Forward Example
Today’s Learning: Exit Ticket • What worked for you in this session? • What will you change as a result of your learning today? • What are you wondering? • What do you need now?
Thank you for your attention and hard work. Help Us Learn from You Facilitator: Workshop:
- - - + + + + + The MAP® Adaptive Assessment AdultReading MAP Test x x x x x x x 6th Grade - x x x x x - x x - 195 x Beginning Literacy
Achievement scale is an equal-interval scale Used to show growth over time Independent of grade level Rasch unIT (RIT) Scale Grade-Level Norms RIT Skills Data 250 DesCartes or Primary Grades Instructional Data 10 9 8 7 7 6 6 5 4 3 2 1 K 120
Measuring Growth 221-230
Grade-level norms Typical performance Beginning-of-Year, Middle-of-Year, and End-of-Year Normative Data: Bringing Context to the Data
NWEA™ Research typical • What are expected RIT and growth scores? • Normative Data, grades K-10 • Scale Alignment Studies • Aligns RIT scale with state proficiency benchmarks • NWEA Goal Structures
Instructional Level vs. Mastery • The MAP test: • Provides information about the instructional level of the student. • Provides a road map for students toward achieving mastery. • Is not a test for determining mastery of skills.
Ready for Instruction Today RIT Skills and Concepts • Ready for • Instruction • Today 250 DesCartesor Primary Grades Instructional Data 195 120