STATISTICS FOR BUSINESS
190 likes | 215 Views
STATISTICS FOR BUSINESS. Chapter 6 : Methods and theory of statistical sampling. November 3, 1948. STATISTICS FOR BUSINESS ( Methods and theory of statistical sampling). We sample to infer population characteristics ( average or proportion). November 3, 1948.

STATISTICS FOR BUSINESS
E N D
Presentation Transcript
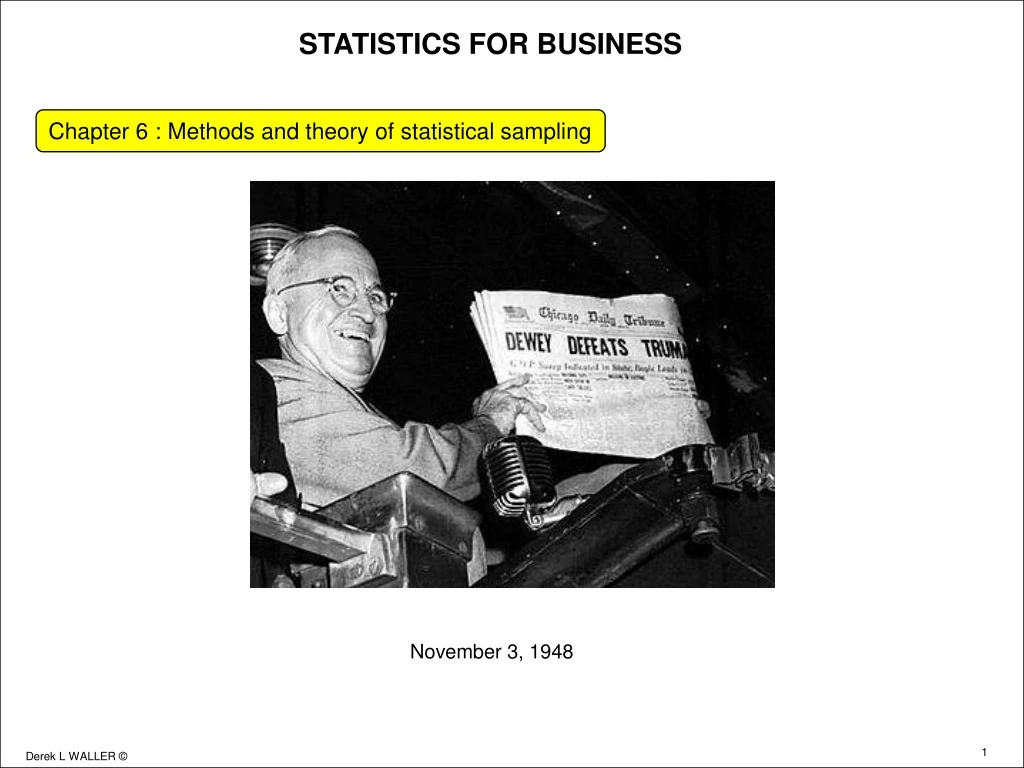
STATISTICS FOR BUSINESS Chapter 6 : Methods and theory of statistical sampling November 3, 1948
STATISTICS FOR BUSINESS (Methods and theory of statistical sampling) We sample to infer population characteristics (average or proportion) November 3, 1948 • Consumers attend wine tasting events – I like it! • They decide from samples how a particular bottle or case of wine will taste • A poll is made from 1.000 people of their approval of the prime minister • Assumption is made that the results represent the opinion of the population • You sample 5% of rooms in a 500-room hotel for cleanliness • Assumption is that if sample is good, all rooms are clean • Manufacturer tests a wheel bearing used on a truck to destruction – meets specifications • Inference is that all bearings produced will have the same load characteristics • A hotel chain in January samples for customer satisfaction • Results are considered to represent the year • A sample of 50 apples is taken from a large supply of apples – looks and taste • If sample good, assumption is made that all the apples in the lot meet quality requirements • Sample of concrete is tested for construction strength. If conforms: • Assumption made concrete used in construction meets rigorous specifications for earthquake zones It is impossible , uneconomic, impossible, too time consuming to sample and test whole population Do you drink a case of wine? Do you test, and destroy all the wheel bearings?
STATISTICS FOR BUSINESS (Methods and theory of statistical sampling) November 3, 1948 • Simple random sampling • Each item in a population has equal chance of being selected • Use random variable function in Excel to identify populations units • Sampling with replacement • Taking item from population, analyzing, then replacing it in the population • In a finite population, probability of selection remains the same. • In pack of cards, selection of one item is always 1/52 • Sampling without replacement • Taking item from population, analyzing, and not replacing it in the population • For an infinite population, (nitrates in a river) probability barely changes. • For an finite population probability changes as more items are selected • Systematic sampling • Elements selected from population at uniform interval of time, order, or space • Every km of highway for repairs; every 10 years for population census, every 25 cans in filling process
STATISTICS FOR BUSINESS (Methods and theory of statistical sampling) November 3, 1948 Stratified Sampling Population divided into relatively homogeneous groups (strata) [compare a coal strata] • In statistical surveys. stratified sampling may involve: • Grouping persons according to age: Persons in age group 20-30 years have different • preference for automobiles, clothing, entertainment, …..than those in 40-50 age group. • Grouping people according to gender: Men and women have different ideas on many subjects • Grouping people according to origin: People in Asia, South America, Europe, and North America have • different cultures and this impacts attitudes about many topics and feelings Stratified sampling more accurately reflect characteristics of target population and avoids erroneously diluting these characteristics • Stratified Sampling • Used when a small variation within each group in a population: but a wide variation between each group in that population. • Teenagers (13-19 ) and parents (40-50)
STATISTICS FOR BUSINESS (Methods and theory of statistical sampling) November 3, 1948 Cluster Sampling Population is divided into groups. or clusters and each cluster is then sampled at random Assume a city is targeted for preference of a certain consumer product This city divided into clusters using city map. Appropriate number of clusters selected for analysis Cluster sampling. if properly designed can provide more accurate results than simple random sampling of the population • Cluster sampling • Used when there is considerable variation in each group (cluster) but groups are essentially similar. • Group 1 students in a statistics class in morning; Group 2 students in the statistics class in afternoon
STATISTICS FOR BUSINESS (Methods and theory of statistical sampling) November 3, 1948 • In market research interviewers may use Quota sampling • A specific number or target to be surveyed • Population is stratified according to profile required • Ladies, 25 -35 for clothing/perfume • Men, 40+ for preferred alcoholic beverage • Young people 18 – 25 for preferred sports activity • May be carried out by interviewers in busy walking zone • Stratifying helps to ensure reasonable probability of success • If you wonder why an interviewer does not stop you? You probably do not fit the strata!
STATISTICS FOR BUSINESS (Methods and theory of statistical sampling) November 3, 1948 In sampling, avoid bias Bias is favoritism (purposely or unknowingly) present in data to give lopsided, misleading, or unrepresentative results To obtain the voting intentions of the people in the UK you sample people who live in the West End of London (The west end is a wealthy district) To measure the average IQ (intelligence quotient) of 18-year old students for a particular year you take a sample from a private school (Private schools often have students from families of upper socio-economic background To measure the average income of residents of Los Angeles county , USA you take a sample of people who live in Santa Monica (Santa Monica is an expensive city) To measure the quality of tour hotel/restaurant service you target only women, or men, or just one nationality Design of sampling experiments must be such that error of inferring the population parameter is minimized
STATISTICS FOR BUSINESS (Methods and theory of statistical sampling) November 3, 1948 Sampling distribution of the mean A probability distribution of all the possible means of the sample Population Water in the river Rhine, Germany Sample Ten 50 cl. bottles Sample statistic Mean ppm of mercury Sampling distribution Sampling distribution of all the means
STATISTICS FOR BUSINESS (Methods and theory of statistical sampling) November 3, 1948 Major goal of sampling is to make inference about a population This is statistical inference….. …..But also, . descriptive statistics Characterizing the sample statistic By convention, symbols of population parameters Size. N Mean. µx Random variable. x Standard deviation. sx By convention symbols of sample statistics Size. n_ Mean of a sample. x Mean of sample means. Standard deviation.s or
STATISTICS FOR BUSINESS (Methods and theory of statistical sampling) • Company is producing a lot (population) of 500,000 chocolate bars • Nominal weight of each chocolate bar is 100 gm • To verify the weight of the population, an inspector takes 10 random samples from production • Each sample contains 15 slabs of chocolate • Mean value of each sample is determined. This is x-bar • Mean value of all the x-bars is x double bar • A distribution can be plotted with x-bar on the x-axis. The mean will be x double bar. November 3, 1948
STATISTICS FOR BUSINESS (Methods and theory of statistical sampling) November 3, 1948 Population distribution of a random variable. X and the sampling distribution of the means taken from this population Population distribution Mean = µx Standard deviation = sx Sampling distribution of the means Standard deviation of the mean, or standard error of mean is
STATISTICS FOR BUSINESS (Methods and theory of statistical sampling) November 3, 1948 • In sampling, with increase in sample size: • Less variability • More sample means are closer to population mean • As sample size increases. standard error of mean decreases • When you sample, the high values and the low values average out • if sample size is just 2 both could be small values • If sample size is 20 more chance to get high and low values • Standard error of the mean • Measure of variability in mean from sample to sample • More sample means are closer to population mean • Given by: Standard error declines with n
STATISTICS FOR BUSINESS (Methods and theory of statistical sampling) November 3, 1948 • Standard deviation applies to the population • It measures a deviation from the population mean • That individual values in the population deviate is not surprising • In a population; • People are of different ages • People are of different weights • People are of different heights • People earn different salaries • People are of different nationalities • That is, values deviate from each other • Thus the standard deviation measures their variability • Standard error is same concept as the standard deviation • It measures the deviation from the mean of the population of which you are making an inference • Sample means vary because of the “error” that occurs in the sampling process • This called the standard error • Standard error is smaller the larger the sample size • Thus the standard error measures the variability in the samples
STATISTICS FOR BUSINESS (Methods and theory of statistical sampling) November 3, 1948 CENTRAL LIMIT THEORY As sample size gets large enough. Sampling distribution of the mean can be approximated by a normal distribution. even though the distribution of the given population is not normal 1. For most population distributions. regardless of shape. sampling distribution of mean will be approximately normally distributed. if sample size is at least 30. 2. If population distribution is symmetric then sampling distribution of mean will be approximately normally distributed. if sample size is at least 15. 3. If population is normally distributed sample distribution of the mean will be normally distributed. regardless of sample size.
STATISTICS FOR BUSINESS (Methods and theory of statistical sampling) November 3, 1948 Sampling. with replacement. from a population normally distributed where: Sampling distribution of the mean will also be normally distributed for any sample size. n
Sampling from finite populations without replacement STATISTICS FOR BUSINESS (Methods and theory of statistical sampling) November 3, 1948
STATISTICS FOR BUSINESS (Methods and theory of statistical sampling) November 3, 1948 Sampling for proportions. Consider: The police force is seeking new recruits. • One criteria is a minimum height of 1.80 m. • It receives 4,500 applications. This is the population • At random it selects 160 applicants from this population • Eight are less than 1.80 m in height In sample, proportion that fit height criterion is (160 – 8)/160 = 95.00% . This is sample proportion, ps “good” Proportion that does not fit criterion is 8/160 = 5.00% . This is sample proportion, q = (1 - ps) “bad” Distribution concept is binomial; either they are above height standard or not • We can approximate using the normal distribution? Since: • n*p = 160*95% = 152 • n*q = 160*5% = 8 • Both these values are greater than 5
STATISTICS FOR BUSINESS (Methods and theory of statistical sampling) November 3, 1948 For binomial distribution Sample size n, characteristic probability p then mean given by Dividing both sides by n. Or mean proportion of successes is Standard deviation. s. for the binomial distribution is. Dividing both sides by n gives the standard error of the proportion Compare this to the standard error of the mean
STATISTICS FOR BUSINESS (Methods and theory of statistical sampling) November 3, 1948 Random sampling of proportions for the outcome of an election Assumption : California is 65% Democrat and 35% Republican Sample of 50 people are taken 40 say they are Republican, 10 say Democrat . (20% Democrat, 80% Republican) Sample of 200 people are taken 150 say they are Republican, 50 say Democrat . (25% Democrat, 75% Republican) Sample of 500 people are taken 240 say they are Republican, 260 say Democrat . (52% Democrat, 48% Republican) Sample of 1,000 people are taken 400 say they are Republican, 600 say Democrat . (60% Democrat, 40 % Republican) Sample of 10,000 people are taken 3,700 say they are Republican, 6,300 say Democrat . (63% Democrat, 37% Republican) Larger the sample size, the closer we arrive at true population proportion Samelogic for samling for the mean