Download
1 / 14
140 likes | 302 Views
Visual Evaluation of JPEG 2000 Color Image Compression Performance (N1583). Testing Group Troy Chinen, Fujifilm Software California Alan Chien, Eastman Kodak. Testing Goals. Quantitative

E N D
Visual Evaluation of JPEG 2000 Color Image Compression Performance (N1583) Testing Group Troy Chinen, Fujifilm Software California Alan Chien, Eastman Kodak
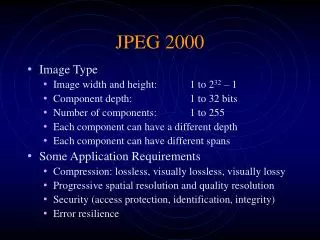
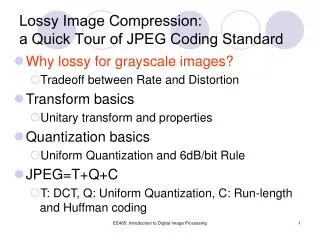
Testing Goals • Quantitative • For a given set of JPEG 2000 bitrates, compute the corresponding quality-equivalent JPEG bitrates for color images. • Qualitative • Characterize JPEG 2000 color compression artifacts.
Testing method Ordered JPEG images • Insert JPEG 2000 images between JPEG images of bounding quality. • Record mean number of bytes for each insertion; fit to Gaussian distribution 1 2 3 4 5 6 7 8 9 10 0.3bpp 0.4 0.5 0.6 0.7 0.8 0.9 1.0 1.2 1.4 C(0.25bpp) B(0.5bpp) A(0.75bpp) D(1.0bpp) VL Unordered JPEG 2000 images
Testing Method (ctd) • 6 scenes: bike, bottles, bride, harbor, woman, wool • 10 Reference JPEG images per scene • default mode cjpeg, optimized Huffman tables • 0.3 ~ 1.0 (0.1 increments), 1.2, 1.4bpp • 4 JPEG 2000 images per scene • Default mode, VM5.2 • Fweights table T15PB • 0.25, 0.50, 0.75, 1.0 bpp
Testing Method (ctd) • Hardcopy: 300 dpi, 24 bit color • Blind testing • 6 Observers • VL (visually lossless) rankings were not included in the summarizing statistics
Results: aggregate 11% 18% 36% 53% Error bars = 2 sigma
Qualitative Results • No color distortions observed • Most JP2 images at 1.0bpp were VL (in print) • Trends:
Conclusions • JPEG 2000 filesizes are smaller than JPEG by • 53% at 0.25bpp • 36% at 0.5 bpp • 18% at 0.75 bpp • 11% at 1.0 bpp • Distortion types of JPEG and JPEG 2000 are fundamentally different, nevertheless consistent rankings were observed.