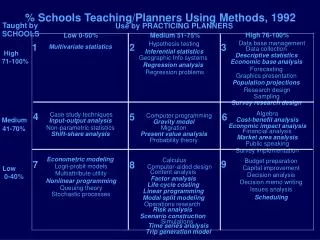
Multivariate Statistics
Multivariate Statistics. Canonical Correlation/Regression Multiple Regression Binary Logistic Regression Hierarchical Linear Modeling. Canonical Correlation/Regression. AKA multiple, multiple regression AKA multivariate multiple regression Have two sets of variables (Xs and Ys)

Multivariate Statistics
E N D
Presentation Transcript
Multivariate Statistics Canonical Correlation/Regression Multiple Regression Binary Logistic Regression Hierarchical Linear Modeling
Canonical Correlation/Regression • AKA multiple, multiple regression • AKA multivariate multiple regression • Have two sets of variables (Xs and Ys) • Create a pair of canonical variates • b1X1 + b2X2 + .... + bpXp , and • a1Y1 + a2Y2 + .... + aqYq • Such that the correlation between the canonical variates is as large as possible.
Patel, Long, McCammon, & Wuensch (1995) • Male college students • Xs = Personality variables (MMPI) • PD (psychopathically deviant, Scale 4) – social maladjustment and hostility • MF (masculinity/femininity, Scale 5) – in men, low scores = stereotypical masculinity • MA (hypomania, Scale 9) – overactivity, flight of ideas, low frustration tolerance, narcissism, irritability, restlessness, hostility, and difficulty with controlling impulses • Scale K (clinical defensiveness) – low scores = unusually frank.
Ys: Homonegativity Variables • IAH (Index of Attitudes Towards Homosexuals) • Affective component of “homophobia,” disgust. • High scores – discomfort around homosexuals • SBS (self-report behavior scale) • Past negative actions towards male homosexuals • High score – high frequency of such actions.
What is a Canonical Variate? • A weighted linear combination of variables • You can think of it as • Something (a superordinate variable) you have created from several variables, or • An estimate of an construct, a latent variable, a dimension that causes variance in the observed variables.
What is This Thing I Have Created or Discovered? • Look at the standardized weights used to construct the canonical variate. • Even better, look at the loadings • Compute, for each case, a score on the canonical variate. • Correlate those scores with scores on the original variables in its set.
The Weights Being stereotypically masculine, unusually frank, psycho. deviant, and hypomanic is associated with acting negatively towards gays.
The Loadings Being unusually frank, hypomanic, stereotypically masculine, and psycho. deviant, is associated with being uncomfortable around and acting negatively towards gays.
Weights or Loadings? • Like the Beta weights in a multiple regression, the weights for a canonical variate can be deceptive. • If two variables within a set are well correlated with each other, one or both weights may be artificially low. • I generally prefer to interpret loadings.
A Second Pair of Canonical Variates • There likely is variance in the variables that was not “captured” by the first pair of canonical variates. • We can create a second pair, orthogonal to the first, from that residual variance. • The number of pairs of canonical variates we can create is equal to the number of variables in the smaller set.
The Second Pair of Weights Being unusually feminine and hypomanic is associated with not being uncomfortable around gays but acting negatively towards them anyhow.
The Equal Opportunity Bully • What are we to make of “not being uncomfortable around gays but acting negatively towards them anyhow.” • One student called this “the equal opportunity bully.” • He acts negatively towards everybody, gay or straight.
The Second Pair of Loadings Being unusually feminine and hypomanic is associated with not being uncomfortable around gays.
The Canonical Correlations • Compute canonical variate scores for each case. • Correlate each with its pairmate. • Will always be highest for first pair, lower for each subsequent pair. • Here, the canonical corrs are .38 and .32. • Both were statistically significant.
Multiple Regression One continuous Y, two or more X variables. X variables may be continuous or dichotomous k groups may be represented by k-1 dichotomous dummy variables
Weight the X Variables • Create a weighted combination of the Xs • Such that the correlation between Y andis as large as possible. • That is, • a is predicted Y when all Xs are zero • bi is number of points Y changes for each one point change in Xi, above and beyond the effect of all other predictors.
Standardized (Beta) Weights • i is the number of standard deviations that Yi changes for each standard deviation change in Xi, above and beyond the effect of all other predictors.
Sequential Analysis • The predictors may be entered into the model all at once (simultaneous), or • In sets of one or more (sequential) • Order of entry may be determined by • Temporal relationships among predictors • A causal model • Economic considerations • Other considerations
Economic Considerations • Want to predict college GPA. • Enter inexpensive predictors first • High school GPA • Verbal and quantitative SAT • Evaluation of an essay submitted by student • Ratings from a panel of professors who interviewed the student on campus.
Stepwise Selection • A statistical algorithm is used to determine order of entry. • The goal is to create a model that has fewer predictors but does nearly as well as a model with all predictors. • Stepwise selection is among the most misunderstood analyses known to man. • It commonly leads to inappropriate conclusions.
Who Will Fail College Physics? • McCammon, S., Golden, J., & Wuensch, K. L. (1988) • Predict grades in physics classes from • Critical Thinking test scores (CT) • Thurstone’s Primary Mental Abilities Test (IQ) • Arithmetic skills test scores (ARI) • Algebra skills test scores (ALG) • Math anxiety scale scores (ANX)
Simultaneous Analysis • R is the correlation between the weighted predictors and Y • R = .40 and was statistically significant. • Model explained 16% of the variance in grades. • Every predictor was sig. correlated with grades (zero-order r). • But in the model only ALG and CT had significant unique effects.
Stepwise Analysis • Tried both Forwards Selection and Backwards Selection • Both led to a model with only ALG and CT. • We recommended that Physics use just the ALG and CT tests to predict who is at risk of failing. • The motivation for using stepwise was economic – why use 5 predictors when 2 will do as well?
Does Sex Matter? • McCammon insisted that I address this issue. • Means and variances differed little between the sexes. • Just to please McCammon, I did the analysis separately for men and women.
Sex Matters • Among the men, not a single predictor was significantly related to grades. • Among the women, every predictor was significantly related to grades. • Women’s performance is class is well related to their abilities. • There must be some other more important factor for predicting men’s performance.
Expert Reviewers • Those at the physics journal to which we submitted the manuscript rejected it. • They argued that it was not appropriate to publish an unexpected finding (the sex difference). • Such “hypothesis-induced blindness” is not all that uncommon, unfortunately.
Political Correctness • We submitted the manuscript to a Science Education journal. • One reviewer insisted that it not be published as it is “sexist” to compare the sexes. • We convinced the editor otherwise.
Binary Logistic Regression • The criterion variable is dichotomous. • Predictor variables may be categorical or continuous. • If predictors are all continuous and nicely distributed, may use discriminant function analysis instead. • If predictors are all categorical, may use logit analysis instead.
Wuensch & Poteat, 1998 • Cats being used as research subjects. • Stereotaxic surgery. • Subjects pretend they are on university research committee. • Complaint filed by animal rights group. • Vote to stop or continue the research.
Purpose of the Research • Cosmetic (test a hair care ingredient) • Theory Testing (neuroscience & learning) • Meat Production (feed the third world) • Veterinary (save cats from disease) • Medical (save young adults from disease)
Predictor Variables • Gender • Ethical Idealism • Ethical Relativism • Purpose of the Research
The Logit Model • Decision 0 = stop, 1 = continue • Gender 0 = female, 1 = male • Model is ….. logit = • is the predicted probability of the event which is coded with 1 (continue the research) rather than with 0 (stop the research).
Decision =Idealism, Relativism, Gender, Purpose • Need 4 dummy variables to code the five purposes. • Consider the Medical group a reference group. • Dummy variables are: Cosmetic, Theory, Meat, Veterin. • 0 = not in this group, 1 = in this group.
Exp(b) is an Odds Ratio • For gender, b was 1.255. • When gender changes from 0 (female) to 1 (male) the odds of approving the research (1) are multiplied by 3.508 • This is above and beyond the effects of other predictors in the model
Effect of Idealism • For idealism, b was -0.701. • For each one point increase in idealism, the odds of approving the research are multiplied by .496. • Put another way, for each one point increase in idealism, the odds of voting to stop the research are multiplied by 1/.496 = 2.016.
Odds Ratios for Dummy Variables • Compares being in one group versus being in the reference group (the one without a dummy variable, medical in this case). • For theory, the odds ratio is .314. • Odds of approving the research are 1/.314 = 3.185 times higher for the medical research than for the theory-testing neuroscience research.
Effects of Purpose of Research • Odds of approving the research were significant lower for ____ than for medical research • Neuroscience research • Agricultural research • But no significant difference for • Cosmetic testing • Veterinary research
Classification • The model can be used to predict, for each case, the probability (p) that the case is the target event (here, approving the research). • You then need a decision rule: If p≥ criterion, then predict it is (or will be) the target event.
The Classification Decision Rule • A criterion of .5 might seem obvious, but that ignores the fact that false positives and false negatives might not be equally serious. • You might want to use a criterion other than .5.
Screening Test for Cancer • Which is the more serious error • False Positive – test says you have cancer, but you do not • False Negative – test says you do not have cancer but you do • Want to reduce the False Negative rate? • Lower the cutoff for predicting that there is cancer.
Classification Performance • Overall Percentage Correct Classifications • Sensitivity • P(correct prediction | event did occur) • Specificity • P(correct prediction | event did not occur) • False Positive Rate • P (incorrect prediction | predicted occurrence) • False Negative Rate • P (incorrect prediction | predicted nonoccurrence)
Hierarchical Linear Modeling • You have data at two or more levels. • Cases at each level (except the highest) are nested within cases at the next level up. • For example, Level 1 is pupils. • Level 2 is schools. • Level 3 is school districts.
School Climate • Rowan et al. (1991) • Level 1 cases are teachers • Outcome Variables at this level are ratings of • Principle leadership • Teacher control of policy • Staff cooperation • Level 1 predictors are teacher demographics
Level 2 • Level 2 cases are schools • Predictors are • Sector: school was public or Catholic • Size of school • Percentage minority enrollment • Average student SES • And other such variables.
Results • Level 1: Ratings were related to demographics • For example, women thought the climate better than did men, and • Those teaching English, Science, and Math thought the climate worse than did others. • Level 2: Ratings were better in Catholic schools than in public schools.
Noise-Induced Annoyance • Fidell et al. (1995) • Humans in households in three different neighborhoods rated, on successive nights • How annoyed they were by aircraft noise • How long it took to fall asleep, and • A machine measured the noise level at night.
The Design: Three Levels • Level 1 cases were the nights (repeated measures). • Level 2 cases were humans. • Level 3 cases were households. • Ratings of annoyance was the outcome variable.
The Predictors • Level 1 (nights): latency to sleep and interior noise level, and neighborhoods were predictors. • Level 2 (humans): age of respondent. • Level 3 (households): neighborhood (three groups)