Trajectories of Care at the End of Life in New Zealand
Trajectories of Care at the End of Life in New Zealand. Department of Public Health University of Otago Wellington May 2019. New Zealand Births and Deaths 1876 to 2018.


Trajectories of Care at the End of Life in New Zealand
E N D
Presentation Transcript
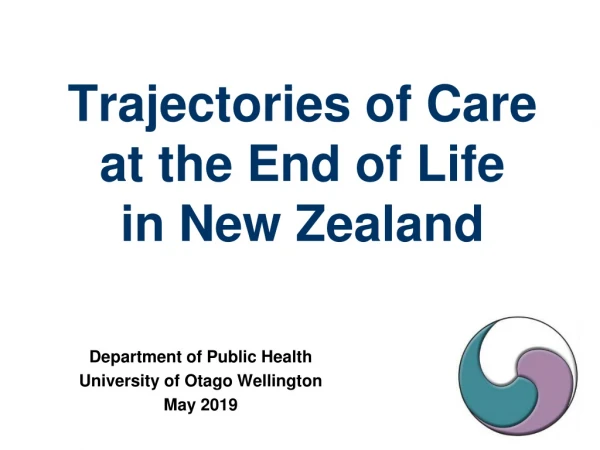
Trajectories of Care at the End of Life in New Zealand Department of Public Health University of Otago Wellington May 2019
New Zealand Births and Deaths 1876 to 2018 Baby Boomers are usually regarded as those born in the years 1946–65. In New Zealand the increase in births began earlier, in 1935, and the number of births peaked in 1961. Data Source: Statistics New Zealand, New Zealand Cohort Life Tables 1876-2015 and 2019 update
Ageing of Deaths 2019 to 2038 Statistics NZ projects for the Ministry of Health in the “2018 Update” that total deaths will increase from 32,600 a year in FY2019 to 45,500 a year by FY2038, an increase of 40%. There are two important effects: the greater number of deaths and the ageing of those deaths. Data Source: Statistics NZ, DHB Births and Deaths Projections 2019-38 (2018 Update)
Ageing of Māori Deaths 2018 to 2038 Māori deaths are projected to increase from 3,700 a year in FY2019 to 5,100 a year by FY2038, an increase of 38%. There is projected to be a change in the shape with fewer deaths in the 45-69 range and a substantial increase in deaths from age 70 onwards. Data Source: Statistics NZ, DHB Births and Deaths Projections 2019-38 (2018 Update)
Trajectories at the End of Life • Accidents - early adult years The three characteristic trajectories illustrated are roughly sequential : • Cancer - peaking around age 65 • Organ failure - about a decade later, around age 75 • Frailty and dementia - those who live past their mid-80s. Source: Palliative Care Australia (2010). Health System Reform and Care at the End of Life: a Guidance Document. 2010. Canberra: Palliative Care Australia. Diagram from Lynn, J., & Adamson, D. M. (2003). Living Well at the End of Life. Adapting Health Care to Serious Chronic Illness in Old Age. 2003. RAND Health.
Independent Life Expectancy, MoH Study 1996–2013 • Female New Zealander at 65 years of age in 2013 can expect to live: • another 10.6 years independently, on average, which is 49.5% of her remaining life • a further 10.7 years with functional limitations requiring assistance • non-daily assistance for 5.9 years • daily assistance for final 4.8 years. • Male New Zealander at 65 years of age in 2013 can expect to live : • another 10.2 years independently, on average, which is 54.1% of his remaining life • a further 8.7 years with functional limitations requiring assistance • non-daily assistance for 5.6 years • daily assistance for the final 3.1 years. Source: Ministry of Health (2015) Independent Life Expectancy in New Zealand, 2013.
Trajectories Study and Period • All deaths occurring and registered in 2015 • History of health care utilisation going back ten years where feasible. • Cancer Registry and NMDS are longer (around 25 years). • interRAI is shorter (mostly 3 years, with earlier pilots) • Study question: who is not reached by specialist palliative care (hospices and hospitals) or by aged residential care (ARC). • The intention is to provide an understanding of the different trajectories of care at the end of life. • Advise on feasibility of a minimum data set for hospital palliative care. • Identify funding flows for end of life care.
Trajectories Study Data • Linked data sets, using de-identified NHI number: • Mortality Collection (MORT) • New Zealand Cancer Registry (NZCR) • National Minimum Dataset (Hospital Events) (NMDS) - inpatients • National Non-Admitted Patients Collection (NNPAC) - outpatients • PRIMHD mental health data (PRIMHD) • Laboratory Claims Collection (Labs) • Pharmaceutical Collection (Pharms) • PHO Enrolment Collection (PHO) • General Medical Subsidy Collection (GMS) – other GP used • Disability Support Services (SOCRATES) • Aged Residential Care Subsidies (CCPS) • interRAI Assessments (interRAI) • History of Hospice Care and Hospice IPU for 30hospices
Cancer Registry and Cause of Death In total, 43.0% of all deaths are in the Cancer Registry. 29.5% are in the Cancer Registry and have neoplasm as cause of death. A further 1.0% have neoplasm as cause of death, but are not in the Cancer Registry (neoplasm includes some benign tumours). Of interest are the 13.4% who are in the Cancer Registry but died of another cause – they tend to be older. Data Source: Trajectories Project, linked data for deaths in New Zealand in 2015
Aged Residential Care In total, 43.8% of all deaths have an aged residential care subsidy or were recorded as having died in residential care. There is a very strong pattern that increases sharply with age: 73.6% by age 90-94, 82.2% by age 95-99 and 88.7% for those aged 100 or more. Data Source: Trajectories Project, linked data for deaths in New Zealand in 2015
Dementia Sources of Data Importance 27.8% of all dementia identified from mortality data. This shows the impact of the main sources of data and the extent of overlaps. National Collections (NMDS and PHARMS) and interRAI (diagnosis and Cognitive Performance Scale) are the most important sources. There is significant overlap. Data Source: Trajectories Project, linked data for deaths in New Zealand in 2015
Dementia and Cause of Death Dementia is known to be poorly represented as a cause of death. Only 7.6% of all deaths identified as having a form of dementia from mortality data. By combining any evidence of dementia from other sources, we find that a further 19.7% have dementia, making 27.3% of total deaths. Data Source: Trajectories Project, linked data for deaths in New Zealand in 2015
Trajectories Groups The trajectories groups are extracted sequentially as follows: • Dementia: anyone with any evidence of dementia (MORT, hospital, medicines, interRAI diagnosis or Cognitive Performance Scale). • Cancer: no evidence of dementia, any cancer and died of neoplasm, or died of neoplasm (Cancer Registry, MORT). • Chronic Disease: no evidence of dementia, cause of death not neoplasm, any aged residential care subsidy or place of death residential care, or any interRAI. These are effectively the frail older people who need some assistance (ARC or assessed for home care). • Need and Maximal Need: all other causes of death that are included in the need for palliative care or the maximal need for palliative care. They may have chronic disease but are generally younger. Includes a young group receiving Disability Support Services if not already allocated. • Other Sudden Deaths: cause of death is not in maximal need for palliative care and not already allocated above. Data Source: Trajectories Project, linked data for deaths in New Zealand in 2015
Trajectories Groups Trajectories Groups allocated sequentially: Dementia, Cancer (diagnosed cancer, died of neoplasm), Chronic Disease (needing ARC or interRAI assessment for home care), Need and Maximal Need (including Disability Support Services), Other Sudden Deaths. Data Source: Trajectories Project, linked data for deaths in New Zealand in 2015
Trajectories Groups - Deaths in 2038 Statistics NZ projects that total deaths will reach 47,400 a year by 2038, which is 52.2% higher than in the Trajectories Study. We expect a greater number of deaths and an ageing of those deaths by 2038. Data Source: Trajectories Project, linked data for deaths in New Zealand in 2015 Projections by Statistics NZ for Ministry of Health, 2017 Update.
Trajectories Groups The groups are allocated from left to right. The Dementia and Cancer groups are large in their own right. The amalgamated Chronic Disease group is almost the same size. The analysis that follows will typically use these five major groups. Data Source: Trajectories Project, linked data for deaths in New Zealand in 2015
ARC Subsidy or Residential Care Overall 43.8% of people used residential care at some time in their trajectory. This is highest for the Dementia group at 85.5%. More than half of Chronic Disease (51.3%) and more than a quarter of the Cancer group (27.0%) had an ARC subsidy or died in residential care. Data Source: Trajectories Project, linked data for deaths in New Zealand in 2015
Days in Public Hospital pppa All groups have increasing utilisation throughout the ten years and much higher utilisation in the last year of life. Cancer and Chronic Disease have almost the same in LYOL, but Cancer is lower in earlier years. The lowest users of public hospital days are the Other Sudden Death group. Data Source: Trajectories Project, linked data for deaths in New Zealand in 2015
Days of ARC Subsidy pppa The Dementia group have a high and increasing utilisation throughout the ten years. Chronic Disease also have a sustained increase over time but to less than half of the level. Cancer has some usage, particularly in the last year of life. Two groups have no days of ARC subsidy in the last ten years. Data Source: Trajectories Project, linked data for deaths in New Zealand in 2015
Days Hospital, ARC, Hospice IPU pppa The Cancer group has an added 9.2 days from hospice IPU in the LYOL with 1.0 days in Year 2. The Chronic disease group has an added 1.1 days in the LYOL. For all other groups and time periods, the addition of hospice IPU adds small amounts less than one day. Data Source: Trajectories Project, linked data for deaths in New Zealand in 2015
Time before DeathFirst Admission to ARCFirst Referral to Hospice
Timing of First Admission to ARC There are people with very short stays in aged residential care: overall, 43.7% have their first admission less than one year before death and 24.3% have their first admission in the last three months of life. Data Source: Trajectories Project, linked data for deaths in New Zealand in 2015
First Admission to ARC in LYOL Eight people were admitted for the first time on the day of death and 343 in the last week of life. In the last four weeks of life, 1,423 were admitted (11.9% of those with any ARC subsidy). In the last three months of life, 2,897 were admitted for the first time (24.3% of those with an ARC subsidy). Data Source: Trajectories Project, linked data for deaths in New Zealand in 2015
First Referral to Hospice in LYOL Referrals to hospice are happening late in the trajectory: there were referrals in the last three months of life for 60.3% of hospice users, in the last four weeks of life for 33.8% and in the last week of life for 13.3% of hospice users. 117 people were referred to hospice only on the day of death and for 16 people the referral arrived after death. Data Source: Trajectories Project, linked data for deaths in New Zealand in 2015
Need for Palliative CareHospices, Aged Residential Care and Primary Care
Use of Hospice Services Overall, 30.7% of people in the Trajectories study used hospice as part of their end of life trajectory. There is a strong and characteristic pattern by age, with almost 50% of those dying in the age bands from 55 to 70 using hospice. Data Source: Trajectories Project, linked data for deaths in New Zealand in 2015
Use of Hospice Services Overall, 30.7% of people in the Trajectories study used hospice as part of their end of life trajectory. This was highest for the Cancer group at 77.7%. 13.9% of those with Dementia and 17.3% of the Chronic Disease group used hospice. Data Source: Trajectories Project, linked data for deaths in New Zealand in 2015
Specialist Palliative Care and Need It is estimated that specialist palliative care was provided to 38.5% of total deaths. If the assumptions about overlap and spread between groups are valid, then 90% of the Cancer group received specialist palliative care, while only around 18-22% of the Dementia, Chronic Disease, and “Need and Maximal Need” groups did so. This seems plausible. Data Source: Trajectories Project, linked data for deaths in New Zealand in 2015
Specialist Palliative Care and Need May understate specialist paediatric palliative care May understate Specialist Paediatric Palliative Care Data Source: Trajectories Project, linked data for deaths in New Zealand in 2015 It is estimated that specialist palliative care was provided to 38.5% of total deaths. 52.0% of total deaths fall within the definition of need, but were not seen by specialist palliative care (hospices or hospital palliative care). Specialist palliative care met 42.5% of the Trajectory Group Need for Palliative Care.
Hospice, Aged Residential Care, Need Overall, 64.8% used hospice services or aged residential care (ARC). 9.6% of total deaths fall outside the Trajectory Group Need for Palliative Care, leaving a cream group of 25.7% needing on-going palliative care from the primary care team. Some may have seen a hospital palliative care team, but this would have been a short intervention. Data Source: Trajectories Project, linked data for deaths in New Zealand in 2015
Hospice, Aged Residential Care, Need Overall, 64.8% used hospice services or aged residential care (ARC). 9.6% of total deaths fall outside the Trajectory Group Need for Palliative Care, leaving a cream group of 25.7% needing on-going palliative care from the primary care team. Some may have seen a hospital palliative care team, but this would have been a short intervention. Data Source: Trajectories Project, linked data for deaths in New Zealand in 2015
Hospice and Need for Palliative Care Overall, 30.7% of people used hospice as part of their end of life trajectory. The proportion was higher for men (32.2%) than women. By ethnicity, usage was highest for Māori (35.4%) and Asian (32.6%). The low deprivation group (NZDep 1-3) had higher proportional usage than the other groups. The cream gap is highest for women, European and middle levels of deprivation. Data Source: Trajectories Project, linked data for deaths in New Zealand in 2015
Hospice or ARC and Need for PC For deaths at older ages, aged residential care is the setting where palliative care needs to be delivered. The cream group is seen by neither hospice nor aged residential care, and thus relies on primary care and district nursing for palliative care at the end of life. Data Source: Trajectories Project, linked data for deaths in New Zealand in 2015
All Trajectory Groups Daily place of care for each day in the last three years of life, showing all trajectory groups combined. The next slides show the five trajectory groups in the reverse order in which they are extracted. Data Source: Trajectories Project, linked data for deaths in New Zealand in 2015
Other Sudden Deaths Group Daily place of care for each day in the last three years of life, showing the group Other Sudden Deaths. These are deaths not in the definition of Need for Palliative Care and are typically accidents, violence or self-harm. Data Source: Trajectories Project, linked data for deaths in New Zealand in 2015
Need and Maximal Need Group Daily place of care for each day in the last three years of life, showing the group Need and Maximal Need. These are generally younger people, including those who died of congenital conditions. Data Source: Trajectories Project, linked data for deaths in New Zealand in 2015
Chronic Disease Group Daily place of care for each day in the last three years of life, showing the Chronic Disease group. This group is effectively the frail elderly with chronic disease: they either use ARC or have had an interRAI assessment. They have no evidence of dementia and did not die of a neoplasm. Data Source: Trajectories Project, linked data for deaths in New Zealand in 2015
Cancer Group Daily place of care for each day in the last three years of life, showing the Cancer group. This group has no evidence of dementia, are in the Cancer Registry and died of neoplasms. It also includes some who are not in the Cancer Registry but have a neoplasm as the underlying cause of death. Data Source: Trajectories Project, linked data for deaths in New Zealand in 2015
Dementia Group Daily place of care for each day in the last three years of life, showing the Dementia group. This group died of dementia or has evidence of dementia from the National Collections, or interRAI, or is in a secure dementia facility. Data Source: Trajectories Project, linked data for deaths in New Zealand in 2015
Last Year of Life by Trajectory Group Daily place of care for each day in the last year of life (LYOL), showing each trajectory group. Shown as a percentage of each group. Data Source: Trajectories Project, linked data for deaths in New Zealand in 2015
June AtkinsonSenior Data Analyst/Data ManagerDepartment of Public HealthUniversity of Otago, WellingtonEmail: june.atkinson@otago.ac.nzPhone: 04 918-6085
Body, Mind, Soul Earth Heather McLeod Heather McLeod & Associates Ltd Honorary Senior Research Fellow, School of Nursing, University of Auckland Extraordinary Professor, Department of Statistics and Actuarial Science, University of Stellenbosch heather@heathermcleodnz.com www.heathermcleodnz.com