1 / 14

NSF-reported Research Expenditures

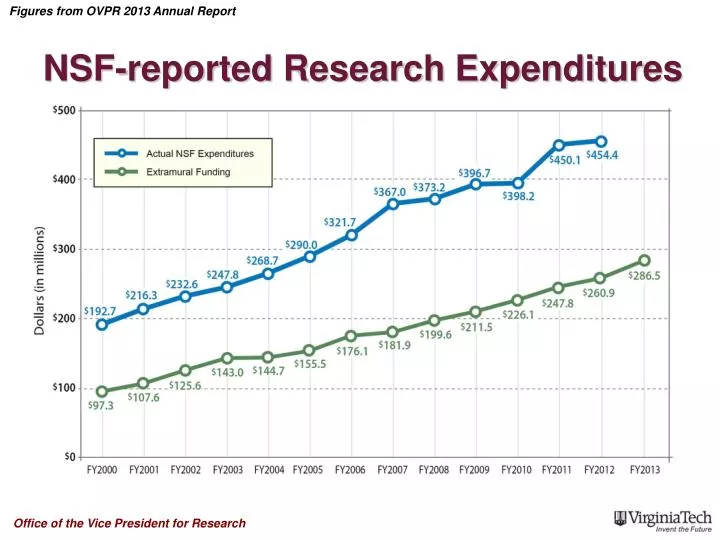
NSF-reported Research Expenditures. NSF Research Expenditure Rankings. More than 900 universities ranked. Less than $25M separated 40th from 48th in FY11. Rankings of selected Virginia Institutions in FY 11. FY 2013 Sponsored Expenditures. All Sources. Federal Sources.

Download Presentation

NSF-reported Research Expenditures

An Image/Link below is provided (as is) to download presentation Download Policy: Content on the Website is provided to you AS IS for your information and personal use and may not be sold / licensed / shared on other websites without getting consent from its author. Content is provided to you AS IS for your information and personal use only. Download presentation by click this link. While downloading, if for some reason you are not able to download a presentation, the publisher may have deleted the file from their server. During download, if you can't get a presentation, the file might be deleted by the publisher.

E N D

Presentation Transcript


  1. NSF-reported Research Expenditures

  2. NSF Research Expenditure Rankings • More than 900 universities ranked. • Less than $25M separated 40th from 48th in FY11. Rankings of selected Virginia Institutions in FY 11

  3. FY 2013 Sponsored Expenditures All Sources Federal Sources

  4. Research Growth by Domain Area

  5. Number and Value of Proposals

  6. Proposals Submitted FY 2002 FY 2006

  7. Proposals Submitted in FY13

  8. Trends in Proposals Submitted

  9. Research Administration Budget Overview

  10. Research Faculty Growth As of July 1, 2013: 744 Research Faculty 56% increase in Research Faculty 2001-2013

  11. Research Administration

  12. Research Administration New areas of responsibility Development of new IT databases/processes was required.

  13. Research Focus AreasMapping to “Plan for a New Horizon”

  14. Targeted Research Expenditures

More Related