Download
1 / 27
270 likes | 403 Views
Hurricane Hazard Data for Caribbean Coastal Construction Project Overview. Funded by the Caribbean Regional Program of the US Agency for International Development. Executed by the Organization of American States, in conjunction with the

E N D
Hurricane Hazard DataforCaribbean Coastal ConstructionProject Overview Funded by the Caribbean Regional Program of the US Agency for International Development. Executed by the Organization of American States, in conjunction with the Engineering Institute of the University of the West Indies. System Design and Analysis by Watson Technical Consulting.
Introduction Project Goals Storm Hazard Assessment Methodology Statistical Methodology Data Bases On-line Data Access System
Project Goals To create an easy to use on-line resource to allow planners and coastal engineers to access basic hurricane hazard data in a format conducive for use in the design process. Hazards reported are wind, wave, and storm surge, for 10, 25, 50, and 100 year return periods. Return period data is characterized at maximum likelihood (MLE), 75%, 90%, and 95% projection limits. Two Web Sites to be established: Primary: University of the West Indies Backup: Old Dominion University
Storm Impacts at the Coast Three phenomena output: Wind, Waves, and Storm Surge. Storm surge outputs include of wave setup, wind setup, pressure setup, and astronomical tide. Wind Wave Run up Still Water Level at Shoreline Wave Crest/TWL Wave Setup Wind Setup Pressure Setup Astronomical Tide Mean Low Water
Methodology Overview Simulate every Atlantic storm since 1886 (1851) with the TAOS hazard modeling system to generate the wind, wave, and storm surge at every grid cell in the study area. At each point, compute weibull distribution for each phenomena. Simulate return period events to test interactions. Compute desired return period and projection limit results.
The Arbiter Of Storms (TAOS) hazard model Modular, 4D composite model platform with user selectable modules: 12 Wind Models 3 Boundary Layer Models 3 Storm Surge Models 5 Wave Models 2 Rainfall/Runoff Models - 1,620 basic combinations - with damage functions, over 10,000 possible outcomes for a single event! Scalable, from single processor through supercomputer MPI or PVM systems such as the WTCI earthdome system. TSAP Statistics System with plug in modules for various distributions, either desktop of batch run capability.
Storm Hazard Model Modules • Key TAOS/mpi Modules: • Wind Field • Water Flow (Storm Surge) • Waves • Tides (UTex CSR Model) • Rainfall and runoff • Damage • Structure Damage • Coastal Erosion • Vegetation Damage • GIS/Mapping Interface • GrADS Meteorology package • ArcInfo and ArcView • Mapinfo • GRASS Storm components are interactive and can have feedbacks: for example, changes to land cover cause changes to wind speeds, etc.
Input Data Bases for Simulations • Digital Elevation Model (topography and bathymetry) Allows proper flow of water to be computed for storm surge, waves, and inland flooding • Land Cover/Land Use (land and underwater) Friction effects on both air and water to compute correct wind speeds and flow rates Debris generation • Historical Storm Characteristics for Statistical Analysis and validation
Model Physics: Wind Module Used: Standard Project Hurricane (SPH) Source: NOAA Technical Report NWS 23 Basic wind field characteristics: Asymmetric wind field Radius of Maximum Winds Storm motion Central and Far Field Pressure Terrain effects: The wind at a point depends on what is upwind of the point, as much as 10 miles. Note storm centered grid system.
Wind Model Validation Example Correlation: 0.9222 Comparison of observed and computed peak winds for Hurricane Floyd (1999)
Model Physics: Storm Surge Modules, vertical coordinates (3D vs. 4D), horizontal resolutions depends on underlying data bases Low Res (> 600 meter grids): vertically integrated equations Source Equations: Harris High Res (< 600 meter grids): 5 vertical layers Source Equations: Watson, based on Mellor Tides: University of Texas CSR Tide Model
Comparisons with Tide Gauges St. Augustine Trident Pier Solid Line: Modeled Dots: Observed
Peak Surge Observations (Marilyn, 1995) Observed peak water levels from post storm surveys on St. Croix and St. Thomas by the USACE
Model Physics: Waves NOAA Wavewatch III Model (deep and transitional water) Source: Tolman, modularized and modified for moving grid WTC inshore model (shallow water) Sources: Lyons, Watson Again, physics used depends on resolution.
Wave Validation Comparison of operational (real time) wave forecast and NOAA buoy reports
Validation Summary Tests against detailed data from over 30 storms worldwide. Performance summary (90% limits) Peak Wind (350 observations): +/- 5 knots Peak Wave (185 observations): +/- 0.8 meters (deep water Hs) Peak Storm Surge (1500 observations): +/- 0.3 meters Model uncertainty is included in the projection limit calculations.
Statistical Terminology MLE: Maximum Likelihood Estimate. The ‘best guess’ at a value. This is NOT the same as the 50% estimate. Projection Limit: For a given projection limit, the value which should not be exceeded more than 1-(limit) of observations. Example: 100 year, 75% projection limit. For a large number of 100 year periods, 75% of them will fall at or below this value. Only 25% should be greater. OR, for a large number of sites over a 100 year period, 75% of the sites will see less than this value; 25% would be expected to exceed it.
Statistical Analysis Once storm runs are completed, outputs are analyzed to produce return period data sets. Single Site Example: Four Seasons Hotel, Nevis
Single Site Analysis: Wind Raw text output of TSAP program: BASIC TC WIND STATISTICS REPORT FOR Nevis 1220 EVENTS EXAMINED FROM 1850 TO 1999 NOTES: RAW DATA IS IN FILE YRMAX.DAT CAT 0 = TROPICAL STORM EVENTS BY CATEGORY SAFFIR/SIMPSON CATEGORY 0: 48 SAFFIR/SIMPSON CATEGORY 1: 9 SAFFIR/SIMPSON CATEGORY 2: 4 SAFFIR/SIMPSON CATEGORY 3: 1 SAFFIR/SIMPSON CATEGORY 4: 1 SAFFIR/SIMPSON CATEGORY 5: 0 ------------------------------------------------ EMPIRICAL ESTIMATE OF RETURN PERIODS SAFFIR/SIMPSON CATEGORY 0: 2.5 YEARS 0.396 SAFFIR/SIMPSON CATEGORY 1: 8.3 YEARS 0.121 SAFFIR/SIMPSON CATEGORY 2: 24.8 YEARS 0.040 SAFFIR/SIMPSON CATEGORY 3: 74.5 YEARS 0.013 SAFFIR/SIMPSON CATEGORY 4: 149.0 YEARS 0.007 SAFFIR/SIMPSON CATEGORY 5: Infinit YEARS 0.000 2 PARAMETER WEIBULL ESTIMATE OF RETURN TIMES ALPHA 1.333316, BETA 35.105717 SDA 0.21 SDB 4.40, CORREL: 0.871427 CHI**2 13.486692 K-S 0.046980, K-S PROB 0.995793 5 YEAR WIND 50KTS (EMP: 52KTS) 10 YEAR WIND 65KTS (EMP: 70KTS) 25 YEAR WIND 84KTS (EMP: 79KTS) 50 YEAR WIND 97KTS (EMP: 89KTS) 100 YEAR WIND 110KTS (EMP: 91KTS) MLE BASED WIND RETURN TIMES WIND SPD PROB RETURN PD 50KTS 0.2014 5.0 YRS 64KTS 0.1078 9.3 YRS 100KTS 0.0176 56.7 YRS ------------------------------------------------ PROJECTION LIMIT CONFIDENCE LEVELS YEAR 50% 75% 90% 95% 99% 10YR: 66.4 69.0 71.4 73.2 76.8 25YR: 85.3 89.3 93.5 96.9 108.8 50YR: 98.5 104.1 110.8 116.7 132.7 100YR: 110.7 118.9 128.7 136.8 157.3
Single Site Statistics: Nevis Wind Graphic output of weibull fit for winds at Four Seasons, Nevis
Statistical Methodology Validation Used data from 1886-1987 to make a 10 year forecast. Validated wind forecast against 10,600 land sites in the Atlantic Hurricane basin using the 10 year period 1988 - 1997. Percentage of sites below prediction limit: Predicted Observed 50% 53% 75% 75% 90% 90% 95% 94% 99% 97%
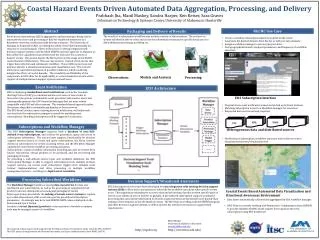
The Caribbean Hazard Data Web Server Interactive, web based system using open source/public domain software. Temporary URL: http://weather.methaz.com/cdcm/ Permanent URL: UWI: ?? ODU: http://cdcm.cee.odu.edu/ Primary site will provide for mailing lists to discuss coastal engineering and design problems, techniques, etc.
On-line Documentation • Notes on wind, wave, and storm surge model outputs • Validation and uncertainty • Terminology • Building Code Notes
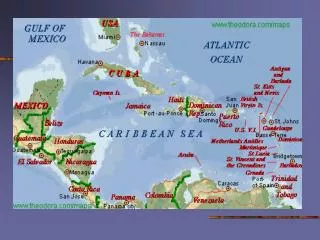
Available Data Bases Regional 30 arc second (nominal 926 meters) As part of the Caribbean Disaster Mitigation Project (CDMP), a regional storm risk atlas was developed. The return period was based on an analysis of hurricanes from 1886 to 1998, with storm hazard model runs conducted using a regional 30 arc second (nominal 926 meter) grid. It covers the Eastern Caribbean from Puerto Rico through Trinidad and Tobago. 6 arc second (182 meter) Kitts/Nevis/Antigua/Barbuda This data set was developed for the Post Georges Disaster Mitigation Project. It covers the islands of St. Kitts, Nevis, Barbuda, and Antigua. The return period analysis was based on data from 1851 through 1999. The storm hazard model runs were made at a resolution of 6 arc seconds (182 meter grid). Only MLE data available for this area. Hurricane Track Data Base This is a version of the 1851-2000 storm track data set created by from the US National Hurricane Center.
Data Set Access • User may select return period and projection limit • Choice of background maps • Point and click report generation
Report Format Site Map and Data Location Site information Hazard Data
Summary • On-line hurricane hazard data for the Eastern Caribbean • 10, 25, 50, 100 year return period data bases • MLE, 75%, 90%, and 95% projection limits for regional data set • R&D site available at http://weather.methaz.com/cdcm/ • Final data sets and user interface by end of September 2001 • Final web sites at UWI and ODU by end of 2001