Download
1 / 38
380 likes | 512 Views
Free Water Access On UW-Seattle Campus. School of Public Health Nutritional Sciences Program March 19, 2013. Introduction. Rising obesity prevalence Public policy is a powerful tool Sugary drinks = more calories Weight gain problems Decreased productivity

E N D
Free Water Access On UW-Seattle Campus School of Public Health Nutritional Sciences Program March 19, 2013
Introduction • Rising obesity prevalence • Public policy is a powerful tool • Sugary drinks = more calories • Weight gain problems • Decreased productivity • Decreased quality of life • Medical costs • Chronic disease risk
Creating A Healthy Environment • Healthy People 2020 Goals • Institute of Medicine Recommendations • Creating food and beverage environments that promote health by ensuring that healthy options are the routine, easy choice
Factors Influencing Water Consumption • Safety concerns • Cleanliness • Water pressure • Functionality • Taste • Appearance
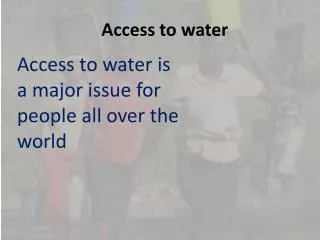
Public Health Goal Reduce chronic disease by lowering consumption of sugary drinks through promotion of free drinking water
Statement of Purpose • Assess sources of free drinking water • Quality • Ease of access • Understand barriers and policy solutions • Assess relevant policies and make recommendations
Data Collection • 277 fountains and bottle fillers in 36 buildings • Flow rate • Temperature • Clarity, smell, color • Cleanliness Ideal Fountain
Data Analysis • 274 analyzed • Flow rate: • Fast: <40 sec • Medium: 40-72 sec • Slow: >72 sec • Temperature: • <15°C • 15-20°C • >20°C • Appearance: • Clean • Dirty: solids, rust, stains
Slow Drainage Data Collection Photo
Broken Fountain Mineral Deposits on faucet
Distribution of Problem Fountains Temperature >15° >40sec to fill 24oz bottle 24 24% 3% 2% 1% • 58% had no problems • 42% had problems 7% 0% 13% Dirty (not including mineral deposits)
Policy Review • Existing policies • Policy opportunities
WA State Drinking Fountain Policy • > 30 Occupants: • first 150 occupants: 1 drinking fountain • 1 fountain for each additional 500 occupants • Sporting facilities: • 1 drinking fountain for each 1000 occupants.
Campus Building Services Policy • Clean and sanitary fountains • Problems: • Budget • Campus size • Number of custodians
Policy Recommendations • Create new Freshmen Orientation module • Adopt healthy food and beverage guidelines for meetings on campus • Enforce existing fountain maintenance policy • Marketing campaign
FreshmenOrientation Module • Current curriculum: Health and Wellness session • Policy recommendation: Add 30-min module to include research on sugary drinks • Discuss benefits of drinking tap water • Provide refillable bottle and map of fountains
Adopt healthy food and beverage guidelines for meetings at UW • Specify tap water to be provided at meetings
Enforce Existing Fountain Maintenance Policy • Existing policy: fountains to be cleaned daily • Reality: cuts to higher education = greater demand on cleaning staff • Daily cleaning overlooked • Visual appeal important for fountain use
Marketing Campaign:Audience • Students • Primary Audience • Most affected by the problem • Most likely to change their behavior • Most feasible to reach • Contemplation stage ready to change • Faculty, facilities and maintenance staff • Secondary Audience
Marketing Campaign:Audience • Aspirations of Students • Improve academic performance • Maintain health • Minimize weight gain • Reduce debt • How to get them to change? • Competing behaviors against which you can “win”
Marketing Campaign:Outreach Information channels used • Posters (shocking=most effective) • Peers, word of mouth • Freshmen Orientation Specific activity • Poster campaign • Free, refillable water bottles • More water bottle fillers
Previously Developed Tap Water Campaigns • Are You Pouring on the Pounds • New York City • I Love Tap Water • University of Wisconsin-Stout • I Love Tap Water • UC Berkeley
Limitations of Assessment • Quality = Multi-factor measurements • Important measures not assessed • Contaminants in water • Spatial access • Slight intergroup differences in collecting the data
Conclusion • Purpose: • Evaluate access to drinking water • Identify barriers to free water access • Identify opportunities for policy • Findings: • 95% of fountains and bottle fillers were free of mold, mildew, odors, colors, and fluid waste
Conclusion • Policy Opportunities at UW: • Create new Freshmen Orientation module • Adopt healthy food and beverage guidelines for meetings on campus • Enforce existing fountain maintenance policy • Marketing campaign