Download
1 / 29
290 likes | 467 Views
Long Term Trends of Surface Ozone Level. L u X u Xiaoxi Liu Benjamin Sheyko. Overview. 1. Introduction 2. Long-term changes in surface O 3 of global scale - N.H. and S.H. 3. Long-term changes in surface O 3 levels in the United States (1980-2005)

E N D
Long Term Trends of Surface Ozone Level Lu Xu Xiaoxi Liu Benjamin Sheyko
Overview • 1. Introduction • 2. Long-term changes in surface O3 of global scale - N.H. and S.H. • 3. Long-term changes in surface O3 levels in the United States (1980-2005) • 4. Effect of Asian emissions on surface O3in the US • 5. Conclusions
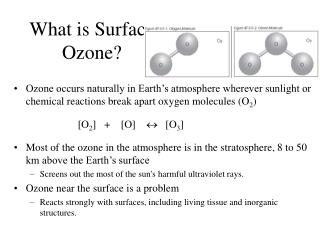
1. Introduction • Ozone in the troposphere is a key ingredient in many atmospheric physical and chemical processes -Radiative forcing -Precursor to the formation of OH -Photochemical ozone production: human health, terrestrial ecosystems • Tropospheric Ozone: - Near ground level: air quality concerns - Entire depth of the troposphere: the climatic and oxidizing impacts of O3 • A lifetime of several days to several weeks, ozone is not a globally or hemisphericallywell-mixed constituent
2. Global long term surface O3 trends • Approach: - Long records (>15 years) • “Background” sites away from precursor sources • Surface observations • To highlight the decadal changes: 1975–1984, 1985–1994 and 1995–2004 Zugspitze, Germany
Changes in the northern hemisphere-High Latitudes • Barrow(70N): a significant 4.8 (±1.7)%/decade increase • Springtime ozone depletion related to bromine chemistry • Periods of both declining and increasing ozone amounts, varying patterns of change on multi-decadal time scales. Average monthly surface ozone at Barrow, Alaska
Changes in the northern hemisphere-Mid Latitudes • Continental Europe showed significant increases in the 1970s and 1980s: Zugspitze, 12.6 (±0.8)%/decade increase • Over North America rises in the 1970s are less than those seen in Europe, suggesting significant regional differences. 44.4N, New York 53.2N, Ireland 28.3N, Spain 19.5N, Hawaii Average monthly surface ozone at Zugspitze, peak of the Wetterstein Mountains, Germany Ozone trend curves in percent deviation at six N.H. surface ozone sites
Changes in the northern hemisphere-Tropics • In the N.H. tropics the surface record in Hawaii show a significant increase (3.5±1.5%/decade) in the autumn months in the most recent decade . • The Hawaiian location sees transport events that may have their origin in East Asia. Seasonal variation in surface ozone (filled symbols) at Mauna Loa Observatory (MLO) and in the 700–500 hPa layer ozone (open symbols) at Hilo, Hawaii
Changes in the southern hemisphere Ozone trend curves in percent deviation at four selected S.H. surface ozone sites: South Pole (90S), Antarctica Cape Point (34.4S), South Africa Cape Grim (40.7S), Australia Samoa (14S) Ozone trend curves inpercent deviation at four selected S.H. surface ozone sites
3. Assessing Surface Ozone Trends in the U.S. From 1980-2005
Background • Breathing ground-level ozone can result in a number of health problems observed in broad segments of the population. Some of these effects and symptoms include: • Induction of respiratory symptoms • Inflammation of airways • Chest tightness, wheezing, or shortness of breath • Throat irritation • Ground-level ozone causes more damage to plants than all other air pollutants combined. "Health Effects of Ozone in the General Population." EPA. Environmental Protection Agency. Web. 10 Apr. 2012. <http://www.epa.gov/apti/ozonehealth/population.html>. "Plant Science Research : Ozone Effects on Plants." Web. 18 Apr. 2012. <http://www.ars.usda.gov/Main/docs.htm?docid=12462>.
Control of U.S. NOxEmission • NOx in the presence of VOC and sunlight can produce Ozone • In 1975 the U.S. was the first to mandate the widespread use of catalytic converters, reducing NOx emissions and the production rate of low level Ozone • To understand the overall trends of Ozone in the U.S., the EPA has made Ozone measurements since before 1980 (286 Sites) • Considering both health and vegetation exposure index can provide the statistical significance of trends as well as quantify the effects anthropogenic behavior.
Ozone Trend Indices/Database • Using several indices are useful for studying the importance of Ozone trends: • Human Health Effects • 2nd highest 1-hour average concentration (1) • 4th highest 8-hour concentration (2) • Vegetation Effects • 24- hour W126 Cumulative Exposure Index (3) • EPA’s Air Quality System database • Validation steps used to sort the 286 monitoring sites • Two data sets were analyzed: (1980 -2005) and (1990 - 2005) Lefohn, A., D. Shadwick, and S. Oltmans. "Characterizing Long-term Changes in Surface Ozone Levels in the United States (1980–2005)." Atmospheric Environment 42.35 (2008): 8252-262. Print.
Monotonic Trend of Surface Ozone • Four cities around the US were chosen and their composite trends were plotted as a function of time • A general slowing downward trend was observed with some noise • Large scale circulation variations • Biomass burning
Summary for US Trends • Nearly all locations experienced a significant downward trend in ozone mixing ratio between 1980 and 2005 and no change between 1990 and 2005 • Some sites experienced increased ozone trends over the study period • Mostly rural or industrial locations • U.S. regulation on emissions has been effective in reducing surface ozone concentrations
Background and Approach Harvard GISS global three-dimensional model of tropospheric chemistry • 1-year archive of meteorological • Horizontal resolution 4°×5° • Meteorological information is updated every 4 hours • Too coarse to revolve urban plumes • Includes 80 species (24 chemical tracers)
Experiments Compare changes of O3 concentration relative to 1985 values Note: emission means anthropogenic emissions, such as NOx, VOC, etc
west east maximum
Asia——, US ↓25% Asia tripled ↑, US ↓25%
Summary for Effects of Asian Emissions • Tripling of Asian anthropogenic emissions from 1985 is expected to increase monthly mean O3 concentrations by 2-6 ppb in the western United States and by 1-3 ppb in the eastern United States • The maximum effect being in April-June • This increase would more than offset the benefits of 25% domestic reductions in anthropogenic emissions of NOx and VOC in the western United States.
Aglobal perspective is necessary when designing a strategy to meet regional O3 air quality objectives
Future work Effect of US emissions on surface ozone in the Asia
5. Conclusions • Data collected around the globe showed that tropospheric ozone increased significantly during the 1970s and 1980s in the mid-latitudes of Europe and North America, but appeared to have leveled off and in some places declined in the more recent decades • Nearly all locations experienced a significant downward trend in ozone mixing ratio between 1980 and 2005 and no change between 1990 and 2005 • U.S. regulation on emissions has been effective in reducing surface ozone concentrations • Asian anthropogenic emissions have great effect on US surface ozone concentrations
References 1. Oltmans, S. J., Lefohn, A. S., Harris, J. M., Galbally, I., Scheel, H. E., Bodeker, G., Brunke, E.,Claude, H., Tarasick, D., Johnson, B. J., Simmonds, P., Shadwick, D., Anlauf, K., Hayden, K., Schmidlin, F., Fujimoto, T., Akagi, K., Meyer, C., Nichol, S., Davies, J., Redondas, A., and Cuevas, E.: Long-term changes in tropospheric ozone, Atmos. Environ., 40, 3156–3173, 2006. 2. Jacob, D. J., Logan, J. A., and Murti, P. P.: Effect of rising emissions on surface ozone in the United States, Geophys. Res. Lett., 26, 2175–2178, 1999. 3. "Health Effects of Ozone in the General Population." EPA. Environmental Protection Agency. Web. 10 Apr. 2012. <http://www.epa.gov/apti/ozonehealth/population.html>. 4."Plant Science Research : Ozone Effects on Plants." Web. 18 Apr. 2012. <http://www.ars.usda.gov/Main/docs.htm?docid=12462>. 5. Lefohn, A., D. Shadwick, and S. Oltmans. "Characterizing Long-term Changes in Surface Ozone Levels in the United States (1980–2005)." Atmospheric Environment 42.35 (2008): 8252-262. Print.