Download
1 / 1
10 likes | 199 Views
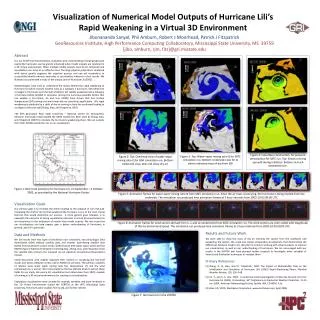
Visualization of Numerical Model Outputs of Hurricane Lili’s Rapid Weakening in a Virtual 3D Environment. Jibonananda Sanyal , Phil Amburn , Robert J Moorhead, Patrick J Fitzpatrick GeoResources Institute, High Performance Computing Collaboratory , Mississippi State University, MS 39759

E N D
Visualization of Numerical Model Outputs of Hurricane Lili’s Rapid Weakening in a Virtual 3D Environment JibonanandaSanyal, Phil Amburn, Robert J Moorhead, Patrick J Fitzpatrick GeoResources Institute, High Performance Computing Collaboratory, Mississippi State University, MS 39759 {jibo, amburn, rjm, fitz}@gri.msstate.edu Abstract It is our belief that the perception, evaluation and understanding of large geophysical events like hurricanes can be greatly enhanced when model outputs are rendered in a 3D virtual environment. Often multiple model outputs need to be compared and visualization can serve as an effective tool. The large physical proportions combined with stereo greatly augment the cognitive process and can aid researchers to successfully identify obvious anomalies or peculiarities inherent in their results. We illustrate our point with a study of the unique case of Hurricane Lili (2002). Meteorologists have tried to understand the reason behind the rapid weakening of Hurricane Lili which crossed western Cuba as a Category 2 hurricane, intensified into a Category 4 hurricane over the Gulf of Mexico but rapidly weakened into a Category 1 hurricane before landfall in Louisiana. Among the numerous possible factors that can weaken a hurrricane, Jin and Liou (2004) have shown that Sea Surface Temperature (SST) cooling and wind shear did not contribute significantly. Lili’s rapid weakening is attributed to a shaft of dry air moving in from the southwest leading to a collapse of the eye wall (Zhang, Xiao, and Fitzpartick 2007). The fifth generation Penn State University – National Center for Atmospheric Research mesoscale model (called the MM5 model) has been used by Zhang, Xiao, and Fitzpatrick (2007) to simulate the hurricane’s weakening phase. We use outputs from their 4DVAR sensitivity runs in our visualization. Figure 1: Best track positions for Hurricane Lili, 21 September – 4 October 2002, as provided by the National Hurricane Center. Figure 4: Isosurface construction for pressure perturbation for SATC run. Top: Shows a strong eye wall during initiation. Bottom: A much weakened core. Figure 3: Top: Water-vapor mixing ratio Q for SATC simulation run. Bottom: Underside view for Q clearly indicates mass of dry from SW. Figure 2: Top: Overhead view of water-vapor mixing ratio Q for BDA simulation run. Bottom: Underside view, does not show dry air.. Figure 5: Animation frames for water-vapor mixing ratio Q from SATC simulation run. Since the air mass is low lying, the hurricane is being studied from the underside. The simulation run produced nine animation frames at 3 hour intervals from 2002-10-03 00:00 UTC. Visualization Goals Our primary goal is to recreate the events leading to the collapse of Lili’s eye-wall. Visualizing the shaft of dry air that weakened the hurricane is one of the most crucial features that would determine our success. A more generic goal, however, is to exemplify the necessity of strong visualization elements in virtual 3D environments to aid researchers in the evaluation of results from model outputs. We also hope that our visualizations can help experts gain a better understanding of hurricanes in general, and Lili in particular. Data and Methods We use results from two types of simulation runs conducted, one using Bogus Data Assimilation (BDA) without satellite data, and another assimilating satellite data (SATC) from QuickSCAT surface winds, GOES-8 cloud drift-water vapor winds and the MODIS Aqua temperature-dewpoint sounding data. Zheng, Xiao, and Fitzpartick show the satellite data contains the low-level dry air signature conventional observations missed. Initial discussions with experts indicated their interest in visualizing the low-level clouds and winds, between 0-2km, and 0-700mb for pressure. The primary variables of interest were water vapor mixing ratio (Q), temperature (T) and the wind components (u, v, and w). We concentrated on the low altitude levels to extract these fields for our study. We used a 3D visualization tool called vGeo from VRCO, capable of running in a 3D virtual environments for creating our visualizations. Exploratory visualizations were created for multiple variables and were rendered in the 3D Virtual Environment (called the VERTEX) at the HPC, Mississippi State University. The results were studied, fine-tuned, and further refined. Figure 6: Animation frames for wind vectors derived from u, v, and w components from SATC simulation run. The wind vectors are color coded with magnitude of the horizontal wind speed. The simulation run produced nine animation frames at 3 hour intervals from 2002-10-03 00:00 UTC. Results and Future Work We were able to show the mass of dry air entering the system from the southwest and weakening the system. We could also create comparative visualizations that demonstrate the differences between model runs. We plan to continue working with subject experts to improve our visualizations as well as our understanding of hurricanes. We are encouraged with our results in the VERTEX and have planned further research to investigate other variables of interest and find better techniques to visualize them. Primary References [1] Zhang, X., Q. Xiao, and P.J. Fitzpatrick, 2007: The Impact of Multisatellite Data on the Initialization and Simulation of Hurricane Lili’s (2002) Rapid Weakening Phase. Monthly Weather Review, 135, 526–548. [2] Jin, Y., and C.-S. Liou, 2004: A numerical model investigation of intensity forecast error for Hurricane Lili (2002). Proceedings,16th Conference on Numerical Weather Prediction, 11-15 Jan. 2004, American Meteorology Society, Seattle, WA, CD-ROM, 3.2a [3] vGeo 3.0, VRCO, Mechdyne Corporation, www.mechdyne.com, April 2008. Figure 7: Hurricane Lili in the VERTEX