Download
1 / 44
440 likes | 568 Views
OPTIMIZES PHYSICAL AND MENTAL HEALTH AND WELL-BEING Community promotes and provides access to necessary and preventive health services • Figs. 11.1-11.15. Rates of screening and vaccination for various conditions among people 60+

E N D
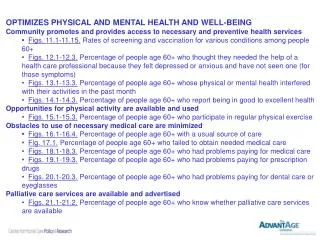
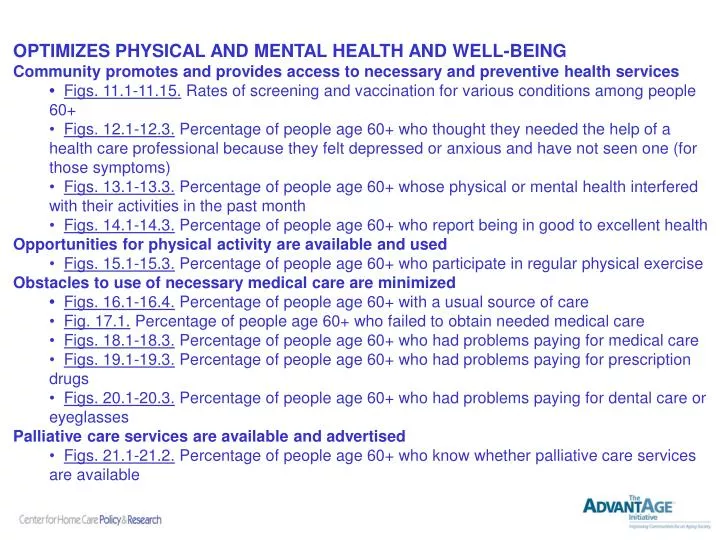
OPTIMIZES PHYSICAL AND MENTAL HEALTH AND WELL-BEING Community promotes and provides access to necessary and preventive health services • Figs. 11.1-11.15. Rates of screening and vaccination for various conditions among people 60+ • Figs. 12.1-12.3. Percentage of people age 60+ who thought they needed the help of a health care professional because they felt depressed or anxious and have not seen one (for those symptoms) • Figs. 13.1-13.3. Percentage of people age 60+ whose physical or mental health interfered with their activities in the past month • Figs. 14.1-14.3. Percentage of people age 60+ who report being in good to excellent health Opportunities for physical activity are available and used • Figs. 15.1-15.3. Percentage of people age 60+ who participate in regular physical exercise Obstacles to use of necessary medical care are minimized • Figs. 16.1-16.4. Percentage of people age 60+ with a usual source of care • Fig. 17.1. Percentage of people age 60+ who failed to obtain needed medical care • Figs. 18.1-18.3. Percentage of people age 60+ who had problems paying for medical care • Figs. 19.1-19.3. Percentage of people age 60+ who had problems paying for prescription drugs • Figs. 20.1-20.3. Percentage of people age 60+ who had problems paying for dental care or eyeglasses Palliative care services are available and advertised • Figs. 21.1-21.2. Percentage of people age 60+ who know whether palliative care services are available
Figure 11.1, Indiana-Area 11§ Rates of screening and vaccination for various conditions amongpeople 60+* Percentage of seniors who received each preventive service in the past year Flu Shot Blood Pressure Eye Exam PSA Test** Hearing Test Physical Exam Bone Density Test Mammogram *** *People were asked whether they had any of the preventive measures or tests above in the past 12 months. Unweighted N=300 Weighted N=34,329 **PSA (prostate cancer screening) test for men only (Unweighted N=149; Weighted N=15,280) ***Mammogram for women only (Unweighted N=151; Weighted N=19,049) § Area 11 includes Bartholomew, Brown, Decatur, Jackson, & Jennings Counties. Source: AdvantAge Initiative Community Survey in Indiana 2008
Figure 11.2, Indiana-Area 11§ Percentage of people age 60+ who had an eye exam in the past year, by demographics Total Age 60-64 Age 65-74 Age 75+ Women Men Unweighted N=300 Weighted N=34,329 § Area 11 includes Bartholomew, Brown, Decatur, Jackson, & Jennings Counties. Source: AdvantAge Initiative Community Survey in Indiana 2008
Figure 11.3, Indiana-Area 11§ Percentage of people age 60+ who had an eye exam in the past year, by demographics (cont’d) Total Education >HS Education <HS Ex/vg/good health Fair/poor health Live w/others Live alone Unweighted N=300 Weighted N=34,329 § Area 11 includes Bartholomew, Brown, Decatur, Jackson, & Jennings Counties. Source: AdvantAge Initiative Community Survey in Indiana 2008
Figure 11.4, Indiana-Area 11§ Percentage of people age 60+ who had a flu shot in the past year, by demographics Total Age 60-64 Age 65-74 Age 75+ Women Men Unweighted N=300 Weighted N=34,329 § Area 11 includes Bartholomew, Brown, Decatur, Jackson, & Jennings Counties. Source: AdvantAge Initiative Community Survey in Indiana 2008
Figure 11.5, Indiana-Area 11§ Percentage of people age 60+ who had a flu shot in the past year, by demographics (cont’d) Total Education >HS Education <HS Ex/vg/good health Fair/poor health Live w/others Live alone Unweighted N=300 Weighted N=34,329 § Area 11 includes Bartholomew, Brown, Decatur, Jackson, & Jennings Counties. Source: AdvantAge Initiative Community Survey in Indiana 2008
Figure 11.6, Indiana-Area 11§ Percentage of people age 60+ who had a blood test for prostate cancer (PSA)* in the past year, by demographics Total ‡ Age 60-64 Age 65-74 ‡ Age 75+ Unweighted N=149 Weighted N=15,280 *PSA (prostate cancer screening) test for men only ‡ This percentage is based on fewer than 20 respondents (Unweighted N<20) and should be interpreted with caution. § Area 11 includes Bartholomew, Brown, Decatur, Jackson, & Jennings Counties. Source: AdvantAge Initiative Community Survey in Indiana 2008
Figure 11.7, Indiana-Area 11§ Percentage of people age 60+ who had a blood test for prostate cancer (PSA)* in the past year, by demographics (cont’d) Total Education >HS Education <HS Ex/vg/good health ‡ Fair/poor health Live w/others ‡ Live alone Unweighted N=149 Weighted N=15,280 *PSA (prostate cancer screening) test for men only ‡ This percentage is based on fewer than 20 respondents (Unweighted N<20) and should be interpreted with caution. § Area 11 includes Bartholomew, Brown, Decatur, Jackson, & Jennings Counties. Source: AdvantAge Initiative Community Survey in Indiana 2008
Figure 11.8, Indiana-Area 11§ Percentage of people age 60+ who had a complete physical exam in the past year, by demographics Total Age 60-64 Age 65-74 Age 75+ Women Men Unweighted N=300 Weighted N=34,329 § Area 11 includes Bartholomew, Brown, Decatur, Jackson, & Jennings Counties. Source: AdvantAge Initiative Community Survey in Indiana 2008
Figure 11.9, Indiana-Area 11§ Percentage of people age 60+ who had a complete physical exam in the past year, by demographics (cont’d) Total Education >HS Education <HS Ex/vg/good health Fair/poor health Live w/others Live alone Unweighted N=300 Weighted N=34,329 § Area 11 includes Bartholomew, Brown, Decatur, Jackson, & Jennings Counties. Source: AdvantAge Initiative Community Survey in Indiana 2008
Figure 11.10, Indiana-Area 11§ Percentage of people age 60+ who had a mammogram* in the past year, by demographics Total Age 60-64 Age 65-74 Age 75+ *Mammogram for women only Unweighted N=151 Weighted N=19,049 § Area 11 includes Bartholomew, Brown, Decatur, Jackson, & Jennings Counties. Source: AdvantAge Initiative Community Survey in Indiana 2008
Figure 11.11, Indiana-Area 11§ Percentage of people age 60+ who had a mammogram* in the past year, by demographics (cont’d) Total Education >HS Education <HS Ex/vg/good health ‡ Fair/poor health Live w/others Live alone Unweighted N=151 Weighted N=19,049 *Mammogram for women only ‡ This percentage is based on fewer than 20 respondents (Unweighted N<20) and should be interpreted with caution. § Area 11 includes Bartholomew, Brown, Decatur, Jackson, & Jennings Counties. Source: AdvantAge Initiative Community Survey in Indiana 2008
Figure 11.12, Indiana-Area 11§ Percentage of people age 60+ who had a hearing test in the past year, by demographics Total Age 60-64 Age 65-74 Age 75+ Women Men Unweighted N=300 Weighted N=34,329 § Area 11 includes Bartholomew, Brown, Decatur, Jackson, & Jennings Counties. Source: AdvantAge Initiative Community Survey in Indiana 2008
Figure 11.13, Indiana-Area 11§ Percentage of people age 60+ who had a hearing test in the past year, by demographics (cont’d) Total Education >HS Education <HS Ex/vg/good health ‡ Fair/poor health Live w/others ‡ Live alone Unweighted N=300 Weighted N=34,329 ‡ This percentage is based on fewer than 20 respondents (Unweighted N<20) and should be interpreted with caution. § Area 11 includes Bartholomew, Brown, Decatur, Jackson, & Jennings Counties. Source: AdvantAge Initiative Community Survey in Indiana 2008
Figure 11.14, Indiana-Area 11§ Percentage of people age 60+ who had a bone density test in the past year, by demographics Total Age 60-64 Age 65-74 ‡ Age 75+ Women ‡ Men Unweighted N=300 Weighted N=34,329 ‡ This percentage is based on fewer than 20 respondents (Unweighted N<20) and should be interpreted with caution. § Area 11 includes Bartholomew, Brown, Decatur, Jackson, & Jennings Counties. Source: AdvantAge Initiative Community Survey in Indiana 2008
Figure 11.15, Indiana-Area 11§ Percentage of people age 60+ who had a bone density test in the past year, by demographics (cont’d) Total Education >HS Education <HS Ex/vg/good health ‡ Fair/poor health Live w/others Live alone Unweighted N=300 Weighted N=34,329 ‡ This percentage is based on fewer than 20 respondents (Unweighted N<20) and should be interpreted with caution. § Area 11 includes Bartholomew, Brown, Decatur, Jackson, & Jennings Counties. Source: AdvantAge Initiative Community Survey in Indiana 2008
Figure 12.1, Indiana-Area 11§ Percentage of people age 60+ who thought they needed the help of a health care professional because they felt depressed or anxious and have not seen one (for those symptoms)* Needed professional help Has not seen a health professional 53% ‡ Did not need professional help 92% 8% Has seen a health professional 48% DK/RF <1% ‡ ‡ Unweighted N=300 Weighted N=34,329 Unweighted N=23 Weighted N=2,626 *People were asked whether in the past year, there was a time when they thought they needed the help of a health professional or a counselor because they felt depressed or anxious. *People who answered “yes” were asked whether they obtained the professional help or counseling they thought they needed. Note: Percentages may not add up to 100% due to rounding and/or missing information. ‡ This percentage is based on fewer than 20 respondents (Unweighted N<20) and should be interpreted with caution. § Area 11 includes Bartholomew, Brown, Decatur, Jackson, & Jennings Counties. Source: AdvantAge Initiative Community Survey in Indiana 2008
Figure 12.2, Indiana-Area 11§ Percentage of people age 60+ who thought they needed the help of a health care professional because they felt depressed or anxious,* by demographics Total Age 60-64 ‡ ‡ Age 65-74 ‡ Age 75+ ‡ Women ‡ Men Unweighted N=300 Weighted N=34,329 *People were asked whether in the past year, there was a time when they thought they needed the help of a health professional or a counselor because they felt depressed or anxious. ‡ This percentage is based on fewer than 20 respondents (Unweighted N<20) and should be interpreted with caution. § Area 11 includes Bartholomew, Brown, Decatur, Jackson, & Jennings Counties. Source: AdvantAge Initiative Community Survey in Indiana 2008
Figure 12.3, Indiana-Area 11§ Percentage of people age 60+ who thought they needed the help of a health care professional because they felt depressed or anxious,* by demographics (cont’d) Total ‡ Education >HS ‡ Education <HS ‡ Ex/vg/good health ‡ Fair/poor health ‡ Live w/others ‡ Live alone Unweighted N=300 Weighted N=34,329 *People were asked whether in the past year, there was a time when they thought they needed the help of a health professional or a counselor because they felt depressed or anxious. ‡ This percentage is based on fewer than 20 respondents (Unweighted N<20) and should be interpreted with caution. § Area 11 includes Bartholomew, Brown, Decatur, Jackson, & Jennings Counties. Source: AdvantAge Initiative Community Survey in Indiana 2008
Figure 13.1, Indiana-Area 11§ Percentage of people age 60+ whose physical or mental health interfered with their activities in the past month, among those who had one or more unhealthy days* 7 or more days 20% 1-6 days 19% 1 or more unhealthy days in the past month 38% None 60% None 61% ‡ 3% DK/RF Unweighted N=300 Weighted N=34,329 Unweighted N=113 Weighted N=12,993 *The number of “unhealthy” days is based on a summary index from the following two questions: 1. “Now, thinking about your physical health, which includes physical illness and injury, for how many days during the past 30 days was your physical health not good?” and 2. “Now, thinking about your mental health, which includes stress, depression, and problems with emotions, for how many days during the past 30 days was your mental health not good?” *People who had one or more “unhealthy” days were asked “During the past 30 days, for how many days did poor physical or mental health keep you from doing your usual activities, such as self-care, work, or recreation?” Note: Percentages may not add up to 100% due to rounding and/or missing information. ‡ This percentage is based on fewer than 20 respondents (Unweighted N<20) and should be interpreted with caution. § Area 11 includes Bartholomew, Brown, Decatur, Jackson, & Jennings Counties. Source: AdvantAge Initiative Community Survey in Indiana 2008
Figure 13.2, Indiana-Area 11§ Percentage of people age 60+ whose physical or mental health interfered with their activities in the past month,* by demographics Total Age 60-64 ‡ ‡ Age 65-74 ‡ ‡ ‡ ‡ ‡ Age 75+ ‡ ‡ Women ‡ ‡ Men Note: Percentages may not add up to 100% due to rounding and/or missing information. Unweighted N=113 Weighted N=12,993 *People who had one or more “unhealthy” days were asked “During the past 30 days, for how many days did poor physical or mental health keep you from doing your usual activities, such as self-care, work, or recreation?” ‡ This percentage is based on fewer than 20 respondents (Unweighted N<20) and should be interpreted with caution. § Area 11 includes Bartholomew, Brown, Decatur, Jackson, & Jennings Counties. Source: AdvantAge Initiative Community Survey in Indiana 2008
Figure 13.3, Indiana-Area 11§ Percentage of people age 60+ whose physical or mental health interfered with their activities in the past month,* by demographics Total ‡ ‡ Education >HS ‡ ‡ Education <HS ‡ ‡ Ex/vg/good health ‡ ‡ Fair/poor health ‡ ‡ Live w/others ‡ ‡ Live alone Note: Percentages may not add up to 100% due to rounding and/or missing information. Unweighted N=113 Weighted N=12,993 *People who had one or more “unhealthy” days were asked “During the past 30 days, for how many days did poor physical or mental health keep you from doing your usual activities, such as self-care, work, or recreation?” ‡ This percentage is based on fewer than 20 respondents (Unweighted N<20) and should be interpreted with caution. § Area 11 includes Bartholomew, Brown, Decatur, Jackson, & Jennings Counties. Source: AdvantAge Initiative Community Survey in Indiana 2008
Figure 14.1, Indiana-Area 11§ Percentage of people age 60+ who report being in good to excellent health* Fair/poor** 17% Excellent/very good/good 83% Unweighted N=300 Weighted N=34,329 Note: Percentages may not add up to 100% due to rounding and/or missing information. *People were asked: “Would you say that, in general, your health is Excellent, Very good, Good, Fair, Poor, or Very poor?” **Includes people who said their health was Fair, Poor, or Very poor. § Area 11 includes Bartholomew, Brown, Decatur, Jackson, & Jennings Counties. Source: AdvantAge Initiative Community Survey in Indiana 2008
Figure 14.2, Indiana-Area 11§ Percentage of people age 60+ who report being in good to excellent health,* by demographics Total ‡ Age 60-64 Age 65-74 ‡ Age 75+ Women Men Unweighted N=300 Weighted N=34,329 Note: Percentages may not add up to 100% due to rounding and/or missing information. *People were asked: “Would you say that, in general, your health is Excellent, Very good, Good, Fair, Poor, or Very poor?” **Includes people who said their health was Fair, Poor, or Very poor. ‡ This percentage is based on fewer than 20 respondents (Unweighted N<20) and should be interpreted with caution. § Area 11 includes Bartholomew, Brown, Decatur, Jackson, & Jennings Counties. Source: AdvantAge Initiative Community Survey in Indiana 2008
Figure 14.3, Indiana-Area 11§ Percentage of people age 60+ who report being in good to excellent health,* by demographics (cont’d) Total ‡ Education >HS Education <HS Live w/others ‡ Live alone Note: Percentages may not add up to 100% due to rounding and/or missing information. Unweighted N=300 Weighted N=34,329 *People were asked: “Would you say that, in general, your health is Excellent, Very good, Good, Fair, Poor, or Very poor?” **Includes people who said their health was Fair, Poor, or Very poor. ‡ This percentage is based on fewer than 20 respondents (Unweighted N<20) and should be interpreted with caution. § Area 11 includes Bartholomew, Brown, Decatur, Jackson, & Jennings Counties. Source: AdvantAge Initiative Community Survey in Indiana 2008
Figure 15.1, Indiana-Area 11§ Percentage of people age 69+ who participate in regular leisure time activity* No activity 31% Some activity 19% Regular leisure time activity 49% Unweighted N=300 Weighted N=34,329 DK/RF 1% ‡ Note: Percentages may not add up to 100% due to rounding and/or missing information. *“Regular leisure time activity” is defined as 1) light or moderate activity that causes light sweating or a light to moderate increase in breathing or heart rate and occurs five or more times per week for at least 30 minutes each time, and/or 2) vigorous activity that causes heavy sweating or large increases in breathing or heart rate and occurs three or more times per week for at least 20 minutes each time. People who engage in other combinations of the two types of physical activities described above are included in the category “some activity.” Those who are unable to or do not engage or seldom engage in physical activity are included in the category “no activity.” ‡ This percentage is based on fewer than 20 respondents (Unweighted N<20) and should be interpreted with caution. § Area 11 includes Bartholomew, Brown, Decatur, Jackson, & Jennings Counties. Source: AdvantAge Initiative Community Survey in Indiana 2008
Figure 15.2, Indiana-Area 11§ Percentage of people age 60+ who participate in regular leisure time activity,* by demographics Total ‡ Age 60-64 Age 65-74 ‡ Age 75+ Women Men Unweighted N=300 Weighted N=34,329 Note: Percentages may not add up to 100% due to rounding and/or missing information. *“Regular leisure time activity” is defined as 1) light or moderate activity that causes light sweating or a light to moderate increase in breathing or heart rate and occurs five or more times per week for at least 30 minutes each time, and/or 2) vigorous activity that causes heavy sweating or large increases in breathing or heart rate and occurs three or more times per week for at least 20 minutes each time. People who engage in other combinations of the two types of physical activities described above are included in the category “some activity.” Those who are unable to or do not engage in physical activity are included in the category “no activity.” ‡ This percentage is based on fewer than 20 respondents (Unweighted N<20) and should be interpreted with caution. § Area 11 includes Bartholomew, Brown, Decatur, Jackson, & Jennings Counties. Source: AdvantAge Initiative Community Survey in Indiana 2008
Figure 15.3, Indiana-Area 11§ Percentage of people age 60+ who participate in regular leisure time activity,* by demographics (cont’d) Total Education >HS Education <HS Ex/vg/good health ‡ ‡ Fair/poor health Live w/others ‡ Live alone Note: Percentages may not add up to 100% due to rounding and/or missing information. *“Regular leisure time activity” is defined as 1) light or moderate activity that causes light sweating or a light to moderate increase in breathing or heart rate and occurs five or more times per week for at least 30 minutes each time, and/or 2) vigorous activity that causes heavy sweating or large increases in breathing or heart rate and occurs three or more times per week for at least 20 minutes each time. People who engage in other combinations of the two types of physical activities described above are included in the category “some activity.” Those who are unable to or do not engage in physical activity are included in the category “no activity.” Unweighted N=300 Weighted N=34,329 ‡ This percentage is based on fewer than 20 respondents (Unweighted N<20) and should be interpreted with caution. § Area 11 includes Bartholomew, Brown, Decatur, Jackson, & Jennings Counties. Source: AdvantAge Initiative Community Survey in Indiana 2008
Figure 16.1, Indiana-Area 11§ Percentage of people age 60+ with a usual source of care* No usual source of care Have a usual source of care 94% ‡ 5% DK/RF 1% ‡ Unweighted N=300 Weighted N=34,329 Note: Percentages may not add up to 100% due to rounding and/or missing information. *People were asked whether there is a place that they usually go when they are sick or need advice about their health. ‡ This percentage is based on fewer than 20 respondents (Unweighted N<20) and should be interpreted with caution. § Area 11 includes Bartholomew, Brown, Decatur, Jackson, & Jennings Counties. Source: AdvantAge Initiative Community Survey in Indiana 2008
Figure 16.2, Indiana-Area 11§ Source of care used most often* Emergency room Hospital outpatient, <1% ‡ ‡ 3% ‡ VA Facility, 1% Doctor’s office 90% 2% ‡ Not one place/ Other/DK/RF 4% Clinic/Health center Unweighted N=300 Weighted N=34,329 Note: Percentages may not add up to 100% due to rounding and/or missing information. *People were asked what kind of place they go to most often - a clinic, doctor’s office, emergency room, or some other place. ‡ This percentage is based on fewer than 20 respondents (Unweighted N<20) and should be interpreted with caution. § Area 11 includes Bartholomew, Brown, Decatur, Jackson, & Jennings Counties. Source: AdvantAge Initiative Community Survey in Indiana 2008
Figure 16.3, Indiana-Area 11§ Percentage of people age 60+ with a usual source of care,* by demographics ‡ Total ‡ Age 60-64 Age 65-74 ‡ ‡ Age 75+ ‡ Women ‡ Men Unweighted N=300 Weighted N=34,329 Note: Percentages may not add up to 100% due to rounding and/or missing information. *People were asked whether there is a place that they usually go when they are sick or need advice about their health. ‡ This percentage is based on fewer than 20 respondents (Unweighted N<20) and should be interpreted with caution. § Area 11 includes Bartholomew, Brown, Decatur, Jackson, & Jennings Counties. Source: AdvantAge Initiative Community Survey in Indiana 2008
Figure 16.4, Indiana-Area 11§ Percentage of people age 60+ with a usual source of care,* by demographics (cont’d) Total ‡ ‡ Education >HS ‡ Education <HS ‡ Ex/vg/good health Fair/poor health ‡ ‡ Live w/others ‡ Live alone Unweighted N=300 Weighted N=34,329 Note: Percentages may not add up to 100% due to rounding and/or missing information. *People were asked whether there is a place that they usually go when they are sick or need advice about their health. ‡ This percentage is based on fewer than 20 respondents (Unweighted N<20) and should be interpreted with caution. § Area 11 includes Bartholomew, Brown, Decatur, Jackson, & Jennings Counties. Source: AdvantAge Initiative Community Survey in Indiana 2008
Figure 17.1, Indiana-Area 11§ Percentage of people age 60+ who failed to obtain needed medical care* 5% Did not obtain care ‡ Needed medical care 46% Did not need medical care 53% Obtained care 95% DK/RF <1% ‡ Unweighted N=300 Weighted N=34,329 Unweighted N=138 Weighted N=15,856 *People were asked whether in the past year there was a time when they thought they needed medical care because they felt sick. *People who answered “yes” were asked whether they saw a medical professional when they felt sick. Note: Percentages may not add up to 100% due to rounding and/or missing information. ‡ This percentage is based on fewer than 20 respondents (Unweighted N<20) and should be interpreted with caution. § Area 11 includes Bartholomew, Brown, Decatur, Jackson, & Jennings Counties. Source: AdvantAge Initiative Community Survey in Indiana 2008
Figure 18.1, Indiana-Area 11§ Percentage of people age 60+ who had problems paying for medical care* Problem paying for medical care No problem paying for medical care 96% ‡ 4% DK/RF <1% ‡ Unweighted N=300 Weighted N=34,329 Note: Percentages may not add up to 100% due to rounding and/or missing information. *People were asked whether there was a time in the past 12 months when they did not have enough money to follow up on tests or treatment recommended by a doctor. ‡ This percentage is based on fewer than 20 respondents (Unweighted N<20) and should be interpreted with caution. § Area 11 includes Bartholomew, Brown, Decatur, Jackson, & Jennings Counties. Source: AdvantAge Initiative Community Survey in Indiana 2008
Figure 18.2, Indiana-Area 11§ Percentage of people age 60+ who had problems paying for medical care,* by demographics Total ‡ Age 60-64 ‡ ‡ Age 65-74 ‡ Age 75+ Women ‡ ‡ Men Unweighted N=300 Weighted N=34,329 *People were asked whether there was a time in the past 12 months when they did not have enough money to follow up on tests or treatment recommended by a doctor. ‡ This percentage is based on fewer than 20 respondents (Unweighted N<20) and should be interpreted with caution. § Area 11 includes Bartholomew, Brown, Decatur, Jackson, & Jennings Counties. Source: AdvantAge Initiative Community Survey in Indiana 2008
Figure 18.3, Indiana-Area 11§ Percentage of people age 60+ who had problems paying for medical care,* by demographics (cont’d) Total ‡ Education >HS ‡ Education <HS ‡ Ex/vg/good health ‡ Fair/poor health ‡ Live w/others ‡ Live alone ‡ Unweighted N=300 Weighted N=34,329 *People were asked whether there was a time in the past 12 months when they did not have enough money to follow up on tests or treatment recommended by a doctor. ‡ This percentage is based on fewer than 20 respondents (Unweighted N<20) and should be interpreted with caution. § Area 11 includes Bartholomew, Brown, Decatur, Jackson, & Jennings Counties. Source: AdvantAge Initiative Community Survey in Indiana 2008
Figure 19.1, Indiana-Area 11§ Percentage of people age 60+ who had problems paying for prescription drugs* Problem paying for prescription drugs No problem paying for prescription drugs 95% ‡ 4% DK/RF 1% ‡ Unweighted N=300 Weighted N=34,329 Note: Percentages may not add up to 100% due to rounding and/or missing information. *People were asked whether there was a time in the past 12 months when they did not have enough money to fill a prescription for medicine. ‡ This percentage is based on fewer than 20 respondents (Unweighted N<20) and should be interpreted with caution. § Area 11 includes Bartholomew, Brown, Decatur, Jackson, & Jennings Counties. Source: AdvantAge Initiative Community Survey in Indiana 2008
Figure 19.2, Indiana-Area 11§ Percentage of people age 60+ who had problems paying for prescription drugs,* by demographics Total ‡ Age 60-64 ‡ ‡ Age 65-74 ‡ Age 75+ ‡ Women ‡ Men Unweighted N=300 Weighted N=34,329 *People were asked whether there was a time in the past 12 months when they did not have enough money to fill a prescription for medicine. ‡ This percentage is based on fewer than 20 respondents (Unweighted N<20) and should be interpreted with caution. § Area 11 includes Bartholomew, Brown, Decatur, Jackson, & Jennings Counties. Source: AdvantAge Initiative Community Survey in Indiana 2008
Figure 19.3, Indiana-Area 11§ Percentage of people age 60+ who had problems paying for prescription drugs,* by demographics (cont’d) Total ‡ Education >HS ‡ ‡ Education <HS Ex/vg/good health ‡ Fair/poor health ‡ Live w/others ‡ ‡ Live alone Unweighted N=300 Weighted N=34,329 *People were asked whether there was a time in the past 12 months when they did not have enough money to fill a prescription for medicine. ‡ This percentage is based on fewer than 20 respondents (Unweighted N<20) and should be interpreted with caution. § Area 11 includes Bartholomew, Brown, Decatur, Jackson, & Jennings Counties. Source: AdvantAge Initiative Community Survey in Indiana 2008
Figure 20.1, Indiana-Area 11§ Percentage of people age 60+ who had problems paying for dental care or eyeglasses* Problem paying for dental care or eyeglasses No problem paying for dental care or eyeglasses 91% 7% 2% ‡ DK/RF Unweighted N=300 Weighted N=34,329 Note: Percentages may not add up to 100% due to rounding and/or missing information. *People were asked whether there was a time in the past 12 months when they did not have enough money to obtain dental care (including checkups) and whether there was a time in the past 12 months when they did not have enough money to obtain eyeglasses. ‡ This percentage is based on fewer than 20 respondents (Unweighted N<20) and should be interpreted with caution. § Area 11 includes Bartholomew, Brown, Decatur, Jackson, & Jennings Counties. Source: AdvantAge Initiative Community Survey in Indiana 2008
Figure 20.2, Indiana-Area 11§ Percentage of people age 60+ who had problems paying for dental care or eyeglasses,* by demographics Total Age 60-64 ‡ Age 65-74 ‡ ‡ Age 75+ Women ‡ ‡ Men Unweighted N=300 Weighted N=34,329 *People were asked whether there was a time in the past 12 months when they did not have enough money to obtain dental care (including checkups) and whether there was a time in the past 12 months when they did not have enough money to obtain eyeglasses. ‡ This percentage is based on fewer than 20 respondents (Unweighted N<20) and should be interpreted with caution. § Area 11 includes Bartholomew, Brown, Decatur, Jackson, & Jennings Counties. Source: AdvantAge Initiative Community Survey Indiana 2008
Figure 20.3, Indiana-Area 11§ Percentage of people age 60+ who had problems paying for dental care or eyeglasses,* by demographics (cont’d) Total Education >HS ‡ Education <HS ‡ ‡ Ex/vg/good health ‡ Fair/poor health ‡ Live w/others Live alone ‡ Unweighted N=300 Weighted N=34,329 *People were asked whether there was a time in the past 12 months when they did not have enough money to obtain dental care (including checkups) and whether there was a time in the past 12 months when they did not have enough money to obtain eyeglasses. ‡ This percentage is based on fewer than 20 respondents (Unweighted N<20) and should be interpreted with caution. § Area 11 includes Bartholomew, Brown, Decatur, Jackson, & Jennings Counties. Source: AdvantAge Initiative Community Survey in Indiana 2008
Figure 21.1, Indiana-Area 11§ Percentage of people age 60+ who know whether palliative care services are available* Don’t know if service available Yes, service available 90% 8% 3% ‡ Not available Unweighted N=300 Weighted N=34,329 Note: Percentages may not add up to 100% due to rounding and/or missing information. *People were asked whether end of life or hospice care service is available in their area. ‡ This percentage is based on fewer than 20 respondents (Unweighted N<20) and should be interpreted with caution. § Area 11 includes Bartholomew, Brown, Decatur, Jackson, & Jennings Counties. Source: AdvantAge Initiative Community Survey in Indiana 2008
Figure 21.2, Indiana-Area 11§ Percentage of people age 60+ who have used palliative care services* Have used 1.3% ‡ Have not used 98.7% Unweighted N=300 Weighted N=34,329 Note: Percentages may not add up to 100% due to rounding and/or missing information. *People were asked whether they had used end of life or hospice care in the last 12 months. ‡ This percentage is based on fewer than 20 respondents (Unweighted N<20) and should be interpreted with caution. § Area 11 includes Bartholomew, Brown, Decatur, Jackson, & Jennings Counties. Source: AdvantAge Initiative Community Survey in Indiana 2008