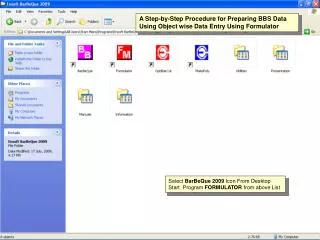
A Simple Drainage Enforcement Procedure for Estimating Catchment Area Using DEM Data
360 likes | 643 Views
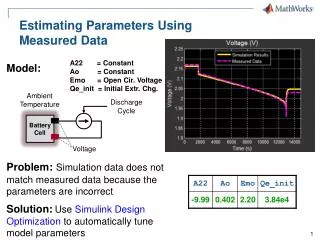
A Simple Drainage Enforcement Procedure for Estimating Catchment Area Using DEM Data. David Nagel, John M. Buffington , and Charles Luce U.S. Forest Service, Rocky Mountain Research Station Boise Aquatic Sciences Lab Boise, ID October 20, 2011. Study Area. Middle Fork Salmon River.

A Simple Drainage Enforcement Procedure for Estimating Catchment Area Using DEM Data
E N D
Presentation Transcript
A Simple Drainage Enforcement Procedure for Estimating Catchment Area Using DEM Data David Nagel, John M. Buffington, and Charles Luce U.S. Forest Service, Rocky Mountain Research Station Boise Aquatic Sciences Lab Boise, ID October 20, 2011
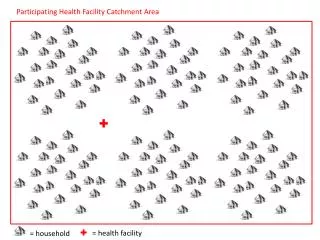
Study Area Middle Fork Salmon River 10,000 km of rivers and streams ~ 1,000 km used by salmon
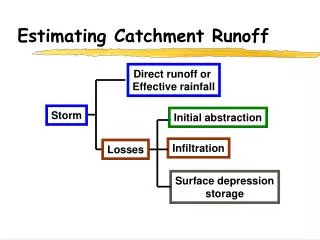
Our Purpose Estimate catchment area Discharge Grain size Salmon spawning habitat
Data 10 m NED DEM dataset http://ned.usgs.gov/ NHD stream lines http://nhd.usgs.gov/
Problem NHD stream DEM flow line Flow accumulation lines from DEMs do not match vector stream lines
Drainage Enforcement Objective Non-enforced Enforced Recondition the DEM so all cells drain toward the stream and downstream
Foundation of Watershed Analysis • Fill • Flow direction • Flow accumulation Fill Direction Accumulation
Flow Accumulation 1,000 12,000 Counting up the number of cells that contribute to a location on the stream = catchment area
Raster Accumulation to Vector Raster accumulation 12,000 cells Attribute corresponding vector
Mismatch Between Raster and Vector Without Enforcement Non-enforced Enforced Can’t attribute vector if data are mismatched
DEM Production Process 1) Aircraft 2) Aerial photo 3) Stereo plotter 6) LT4X 4) Map production 5) Scan and tag LT4X, Infotec Development, Inc.
Original Contours and 10 m DEM Model 500 m LT4X Original 40’ contours 2 m contours derived from 10 m DEM Blue box = 100 m x 100 m
Original Contours and 10 m DEM Model With Streams LT4X 2 m contours derived from 10 m DEM Original 40’ contours
LT4X made the DEMs from the original contours There were no contours in flat valleys, so there wasn’t information for generating the DEM data Cartographers drew stream lines where they saw them, independent of the LT4X model
Why Not Use LiDAR? Site scale vs. landscape scale
Drainage Enforcement Algorithms • ANUDEM - ArcGIS • AGREE – Arc Hydro Tools • IDDEA – Forest Service
ANUDEM Implemented by ArcGIS (Topo to Raster) Not designed for reconditioning DEMs directly - requires contour lines or point input Contour file sets may become too large Avoids “trenching” Hutchinson, M.F., 1989. A New Procedure for Gridding Elevation and Stream Line Data with Automatic Removal of Spurious Pits. Journal of Hydrology, 106:211-232.
AGREE Algorithm Implemented by Arc Hydro Tools Dewald, T., NHDPlus User Guide, U.S. EPA and USGS, April 29, 2008 Hellweger,F., 1997. AGREE — DEM surface reconditioning system. Center for Research in Water Resources
Drainage Enforcement with AGREE Original Reconditioned Arcs must point downstream Sharp drop may modify watershed boundaries Uses “trenching”
IDDEA Method Inverse Distance Drainage Enforcement Algorithm Grid stream lines Generate Euclidean distance from all stream lines Drop stream by constant value (e.g. 200 m) and Invert distance, multiply by constant: (1/d) * 1000 Subtract result from original DEM Where cij, 200, else eij – ((1 / dij) * 1000) cij is a stream channel cell at raster location ij eij is the elevation at ij dij is the Euclidean distance at ij
1) Grid Stream Lines Vector to raster conversion
3) Inverse Euclidean Distance (1/d) * 1000 100 10 200 0.1 50 Value decreases (unitless) 200 0.02 Force constant drop (200 m) at stream channel Enforcement decreases away from the channel
DEM Minus Inverse Distance minus =
Profile Results Preserves relative topography and watershed boundaries
Run Flow Accumulation Non-enforced Enforced
Attributing Vectors Non-enforced Enforced Higher probability of accurately attributing vectors with the correct contributing area
Disadvantages of the IDDEA Method “Trenches” the DEM Meander bends smaller than cell size get cut off and reroute flow “Trenching” Cut-offs
Advantages of the IDDEA Method Works relatively quickly at landscape scales Preprocessing of raster or vector data is not required Preserves relative topography and watershed boundaries