Download
1 / 25
250 likes | 337 Views
Explore livestock system data in the EU, combining statistical and geographic data for policy impact assessment. Includes pig system insights in the Netherlands at farm and regional levels.

E N D
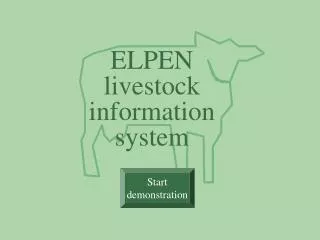
ELPEN livestock information system Start demonstration
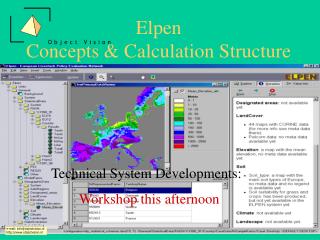
ELPEN livestock information system About: ELPEN livestock information system Area of interest The ELPEN livestock information system contains relevant data and knowledge on livestock systems in the European Union. It displays and combines data and provides impact assessment of policy changes. The diagram below outlines its basic structure. Statistical data About: Geographic data region research Combine data ELPEN livestock information system politician Source data Source data Modelling rules Assess impacts Statistical database Geographic database Knowledge database Impact assessment Policy measures Knowledge Policy measures
ELPEN livestock information system Area of interest Statistical data Geographic data Combine data <= output Data > Assess impacts Impact output Data + - output Knowledge Policy measures EU National Regional Local on farms and regions, organised in 16 modules Geographically located bio-physical data (land cover, soil, climate, landscape, etc.) Combine statistical data with geographic data with the help of GIS tools Economic Social Environmental Legislation: Manure Sanitary/veterinary Support: Price intervention Direct income support Regional support
ELPEN livestock information system Area of interest Statistical data Geographic data Combine data Assess impacts Knowledge Policy measures What data is available on pig systems at a farm level? Example: Netherlands
ELPEN livestock information system Area of interest Area of interest Statistical data Geographic data Combine data Assess impacts Knowledge Policy measures
ELPEN livestock information system Area of interest Statistical data: pig systems in the Netherlands Statistical data Statistical data of: Farm level data Regional level data • Livestock systems: • Dairy (cattle) • Beef (cattle) • Sheep • Goat • Pig • Other • Mixed livestock • Mixed livestock/arable • General description • Primary production system • Technical aspects • Environmental organisation • Farm economic indicators • Origin, transformation and development of systems • Overview • Structural data • Chain of production • Landscape • Socio-economic data • Policy aspects • Ethical aspects • Inter-relationships • Social environment • Map Geographic data Combine data Assess impacts Knowledge Policy measures The Netherlands
ELPEN livestock information system Area of interest Primary production: pig systems in the Netherlands • Based on 90% imported feed • Farms are concentrated in the South and East • of the country • Specialisation: production of piglets/fattening • pigs/breeding boars • Size: On average 165 sows or 380 growing / • finishing places per farm • Energy use: > 250 GJ/ha Statistical data: pig systems in the Netherlands Statistical data Technical aspects: pig systems in the Netherlands Farm level data Regional level data • Litter size: 11 • Litters per year: 2,42 • Mortality of piglets (%): 12 • Weaning age (weeks): 8 • Fattening period (days): 150 • Fattening weight (kg): 110 • General description • Primary production system • Technical aspects • Environmental organisation • Farm economic indicators • Origin, transformation and development of systems • Overview • Structural data • Chain of production • Landscape • Socio-economic data • Policy aspects • Ethical aspects • Inter-relationships • Social environment • Map Geographic data Combine data Overview: pig systems in the Netherlands Assess impacts Knowledge Policy measures The Netherlands
ELPEN livestock information system Area of interest Statistical data Geographic data Combine data Assess impacts Knowledge Policy measures What data is available on pig systems at a regional level? Example: Netherlands
ELPEN livestock information system Area of interest • number of farms: 21.000; • size of farm: 11 ha on average per farm; • labour: • sow farms: 1.9 labour unit (38 hours/week) • growing finishing pig farms: 1.1 labour unit • other pig farms: 2.1 labour unit; • on average 15 % hired labour • breeding sows: 175 per farm on average; • volume of production: 1 255 growing / finishing • pigs per farm per year (on average). • Transport distances: limited; • Transport conditions: short distances for live pigs; • Housing conditions: tethering sows will be prohibited; • Management practices and slaughter procedures: ?; • Treatment of disease: SFD vaccine prohibited; • Supervision guidelines: ?; • Training for stockmen: ?; • Availability of extension and veterinary services: • acceptable Statistical data: pig systems in the Netherlands Statistical data Ethical aspects: pig systems in the Netherlands Structural data: pig systems in the Netherlands Map: pig systems in the Netherlands Farm level data Regional level data Geographic data • General description • Primary production system • Technical aspects • Environmental organisation • Farm economic indicators • Origin, transformation and development of systems • Overview • Structural data • Chain of production • Landscape • Socio-economic data • Policy aspects • Ethical aspects • Inter-relationships • Social environment • Map Combine data Assess impacts Knowledge Policy measures The Netherlands
ELPEN livestock information system Area of interest Statistical data Geographic data Combine data Assess impacts Knowledge Policy measures What is the location of and livestock density of land dependent livestock systems within the European Union?
Livestock density in land dependent livestock systems ELPEN livestock information system Area of interest Output map Statistical data of: • Livestock systems: • Dairy (cattle) • Beef (cattle) • Sheep • Goat • Pig • Other • Mixed livestock • Mixed livestock/arable Livestock location and density in land dependent livestock systems (in LU/ ha) Statistical data Geographic data Grassland, pasture, fodder crops Combine data 0 - 0.5 0.5 - 1.0 1.0 - 1.5 1.5 - 2.0 2.0 - 4.0 > 4.0 no grassland etc. in map no data Assess impacts Knowledge Policy measures EU
ELPEN livestock information system Area of interest Statistical data Geographic data Combine data Assess impacts Knowledge Policy measures Where are nutrient levels liable to exceed acceptable levels under current legislation? Example: The Netherlands
ELPEN livestock information system Area of interest Output map: Nitrate Output map: Phosphate Expected concentration in surface water in 2015 under current legislation Expected concentration in surface water in 2015 under current legislation 0.0 - 0.15 mg/l 0.15 - 0.30 0.30 - 0.60 0.60 - 1.00 1.00 - 2.00 0.0 - 2.2 mg/l 2.2 - 5.0 5.0 - 10.0 10.0 - 15.0 15.0 - 20.0 Statistical data Geographic data Policy measures legislation: • Manure • Sanitary/veterinary • Support: • Price intervention • Direct income • Regional Combine data Assess impacts • Economic • Social • Environmental Assess impacts Knowledge Policy measures The Netherlands current
ELPEN livestock information system Area of interest Output map: Phosphate Expected concentration in surface water in 2015 under current legislation 0.0 - 0.15 mg/l 0.15 - 0.30 0.30 - 0.60 0.60 - 1.00 1.00 - 2.00 Statistical data Geographic data Policy measures legislation: • Manure • Sanitary/veterinary • Support: • Price intervention • Direct income • Regional Combine data Assess impacts No data No data Assess impacts • Economic • Social • Environmental Knowledge Policy measures Brabant current
ELPEN livestock information system Area of interest Number of farms Farm size (LU,ha) Livestock types Manure production Statistical data Geographic data Soil, water conditions N,P load Combine data Assess impacts N,P concentration in surface water Knowledge Policy measures
ELPEN livestock information system Area of interest Statistical data Geographic data Combine data Assess impacts Knowledge Policy measures How will payments under national envelopes be distributed to different types of farms and regions if payments are to be area payments rather than headage payments? Example: Denmark
ELPEN livestock information system Area of interest Distribution of payments by farm size categories (LU/farm) Distribution of payments by livestock density (LU/ha) categories Distribution of payments by farm type categories Statistical data Geographic data Policy measures legislation: • Manure • Sanitary/veterinary • Support: • Price intervention • Direct income • Regional Combine data Headage payment Headage payment Headage payment Assess impacts • Economic • Social • Environmental Assess impacts Knowledge Area payment Area payment Area payment Policy measures Denmark
ELPEN livestock information system Area of interest Shift from headage to area payment Statistical data Geographic data Policy measures legislation: • Manure • Sanitary/veterinary • Support: • Price intervention • Direct income • Regional Combine data Assess impacts • Economic • Social • Environmental Assess impacts Knowledge Regional change in distribution of payments 50 to 210 % 0 to 50% -20 to 0 % -20 to -40% Policy measures Denmark
ELPEN livestock information system Area of interest Farm characteristicsper region (size in LU and ha and livestock types) < 2 LU per ha? Statistical data yes Geographic data Ha grassland, pasture and fodder crops Headage payment Combine data Assess impacts Distribution of area payment Distribution of headage payment Knowledge Policy measures
ELPEN livestock information system Area of interest Statistical data Geographic data Combine data Assess impacts Knowledge Policy measures In which areas would communities be at greatest risk of decline in the absence of regional support? Example: Europe -> Greece
ELPEN livestock information system Area of interest Output map Statistical data Geographic data Policy measures legislation: • Manure • Sanitary/veterinary • Support: • Price intervention • Direct income • Regional Combine data Assess impacts • Economic • Social • Environmental Assess impacts Knowledge Medium risk Areas at high risk of decline No data available Low risk Policy measures Areas of extensification without potentials for new functions Areas of extensification with one or more potentials for new functions No data on potentials for new functions EU
ELPEN livestock information system Area of interest Output map Output map Statistical data Geographic data Policy measures legislation: • Manure • Sanitary/veterinary • Support: • Price intervention • Direct income • Regional Combine data Assess impacts • Economic • Social • Environmental Assess impacts Knowledge Areas at high risk of decline Medium risk No data available Low risk at highest risk of decline of communities at medium risk at no risk Policy measures Areas of extensification without potentials for new functions Areas of extensification with one or more potentials for new functions No data on potentials for new functions Greece
ELPEN livestock information system Area of interest Population density Statistical data LU/community Intensity of agricultural land use Geographic data Ha grass, fodder and pasture land Combine data Accessibility Assess impacts Risk of decline of rural communities Knowledge Policy measures
ELPEN livestock information system Area of interest Output map Data to illustrate decline of rural communities Statistical data Structural data: Greece: Evrytania • Population employed in agriculture : 49 % • Agricultural input in % of GRP : 12.1 % • GRP per capita 1991 (EUR12=100) : 55 • Average size of farm (ha.) : 1.4 ha • Gross annual farm income (‘91):2300 ECU • Farm net value added per labour unit ‘90:63 • (EUR12=100) Geographic data Farm data Regional data Combine data • General description • Primary production systems • Technical aspects • Environmental organisation • Farm economic indicators • Origin, transformation and development • View • Structural data • Chain • Landscape • Socio-economic ind. • Policy aspects • Ethical aspects • Inter-relationships • Social environment • Map Assess impacts Social environment: Greece: Evrytania • Population development 1961-1991: • Absolute decrease: 11559 inhabitants • Relative decrease: 32% • Population aged 65 and more: 28 % • Active population unemployed: 17% • Population density: < 10 inhabitants/km2 Knowledge highest risk for decline of communities medium risk no risk Policy measures Greece: Evrytania
ELPEN livestock information system Exit demonstration