Spoke City
Spoke City. Fraser White 201103398 Zac Hannam 201103841 Andrew Graham 201202808 Nick Parker 201105744. …Any Distance is Biking Distance. Sales of almost $13,000,000 Costs of goods sold just under $6,000,000 Profit of almost $2,500,000 Shareholder value of $26.04

Spoke City
E N D
Presentation Transcript
Spoke City Fraser White 201103398 ZacHannam201103841 Andrew Graham 201202808 Nick Parker 201105744 …Any Distance is Biking Distance
Sales of almost $13,000,000 • Costs of goods sold just under $6,000,000 • Profit of almost $2,500,000 • Shareholder value of $26.04 • Earnings per share $2.41 • 34,349 units sold Overview
$14,786,655 was Spoke City’s greatest sales revenue, it was generated in the year 2016 Drop of sales of 14% from 2016 to 2017 Sales Growth of 2.2% from 2017 to 2018 Key Findings – Sales Growth
The year 2018, Spoke City had their lowest cost of goods sold, as a percentage of sales, sitting at 45.7% Cost of goods sold increased by 1.7% from 2017 to 2018 Key Findings – Cost of Goods Sold
Return on Equity decreased dramatically from 2016 to 2017, but increased from 9.8% to 14.2% from 2017 to 2018 Sales have increase by 51% in the last five years Net Income increased by 67.9% from the year 2017 to 2018 Key Findings – Profitability
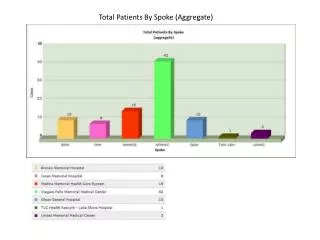
Spoke City introduced two new products, a Youth bike, and a Road bike Main source of income was supplied by Mountain bike (57%) Spoke City had the lowest capacity in the industry with a capacity of only 15000 Marketing Results
Spoke City recorded 0% idle time in 2018, the industry average was 7.7% Spoke City recorded a wastage of 14.4%, the industry average was 17.6% Spoke City’s product quality index was 75%, the industry average was 85% Operations Results
Decreasing debt to equity • After our first year we had a good ratio of 0.47, which shows investors that we would not be a risky company to invest in. Since that year our debt to equity ratio has gradually decreased to what it is now, 0.12 after the year 2018. • Constant Profitability • Our company generated a profit of $1 309 269 in our first year, and since then our profits have been increasing, aside from 2017, the year after our best year where we generated $3 098 510 in 2016. Last year we had profits of $2 409 791 which was up fro, 2017 by $974 663 • Increasing Sales • Like our profits, our sales have been increasing since year one aside from 2017 after our best year and we expect sales to continue to increase as we grow. • Efficiency • Our firm became very efficient through the years 2011- 2017. Our idle time was 0% compared to the industry average of 7.7% and we had a wastage of 14.4% which was 3.3% lower than the industry average. The more efficient our firm can be the more money we will save, maximizing our potential for profit. Strengths
Shareholder Value • Currently our shareholder value sits at $26.04 which is less than half of the industry average of $56.22. • Awareness Rating • Of the six companies we have one of the lowest brand awareness ratings in the industry. We are very close with five of the companies though much below that of X-treme Bikes. • Product Quality • The three bikes that our firm chose to sell are the Adv1, Funksta_2016 and the Annihilator_2017. These three bikes have some of the lowest product quality ratings around 0.75. The highest rated bikes are the Bolt_2016 and the NinjaX_2016 which are around 0.92. • Capacity • In 2017 our firm’s capacity was 15 000, this was 25 000 below the highest of Extreme Bikes and Michael’s Bicycles. This was a major weakness for our firm as it restricted us from being able to meet the demand of our customers. Weaknesses
New Product Options • There are many new products available for our company to begin selling that could help generate more income. The Bolt_2016 and NinjaX_2016 are both very popular bikes with the highest product quality ratings. The NinjaX_2015 was also the most selling bike in the industry recording a total of 64 784 sales. Opportunities
Competitors • We are in a very competitive industry with there being five other companies selling similar products. The two biggest competitors are Michael’s Bicycles and X-treme Bikes whom control the majority of the market, having a combined market share of 61%. • Clustering of Competitors • Aside from the two majority market holders, there are four other companies competing to find an edge and have a larger proportion of the market. The four companies range from having a 4.3% to a 16.9% market share. Threats