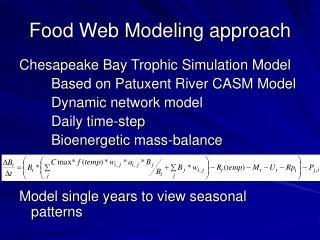

Modeling Approach
E N D
Presentation Transcript
NRL modeling during ONR Monterey Bay 2006 experiment.Igor Shulman, Clark Rowley, Stephanie Anderson, John KindleNaval Research Laboratory, SSCSergio DeRada Peter SakalaukusJacobs-Sverdrup, Inc USMMURI ASAP TEAMSupport from projects:ONR 32 “NRL modeling to support MURI ASAP experiment”NRL 6.1 “Air-Sea Coupling in the Coastal Zone”NRL 6.1 “Physical-Biological-Optical Modeling of the Coastal Environment”
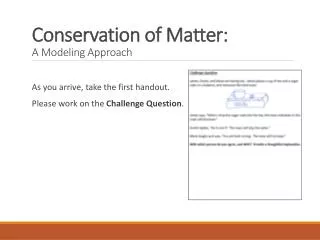
Modeling Approach Chlorophyll REGIONAL NCOM CCS MONTEREY BAY NCOM ICON GLOBAL NCOM 1-4 km • To accommodate the wide range of horizontal scales of physical and biological oceanic processes we use a nested modeling approach in which global models provide boundary data to regional scale models which, in turn, feed coastal models and so on. • Observational data from gliders, aircraft, AUVs and ship are assimilated by using the NRL Coupled Ocean Data Assimilation System. MONTEREY BAY NCOM frsICON 0.5- 1.5 km
NCOM Model • Primitive equations, 3D, hydrostatic model. • Based on POM model but has options for using different advection schemes, open boundary conditions schemes, turbulence closure schemes, etc. • Include routines for direct reading and processing atmospheric model COAMPS outputs. Possibility of two-way coupling with COAMPS. • OSU tidal constants are used for tidal forcing • Sigma or hybrid (sigma-z) (sigma on top, z on bottom) vertical coordinate systems. • Parallelized code runs on different computer platforms.
Ocean Data Assimilation (NCODA) Ocean Obs Sequential Incremental Update Cycle Analysis-Forecast-Analysis SST: Ship, Buoy, AVHRR (GAC/LAC), GOES, AMSR-E, MSG, AATSR SSS: TSG Temp/Salt Profiles: XBT, CTD, Argo Float, Buoy (Fixed/Drifting), Gliders SSH: Altimeter, T/S profiles Sea Ice: SSM/I Ocean QC Innovations 3D MVOI Increments Ocean Model First Guess Forecast Fields Prediction Errors Model forecast fields and prediction errors are used in the QC of newly received ocean observations
Real-Time Modeling Strategy • RUN 1 (non-assimilative run)was initialized on July 11th from the regional model NCOM CCS and spun up with tidal forcing, COAMPS 3km surface fluxes and with the NCOM CCS on open boundaries. Testing of the COOP system. NCOM CCS and NCOM ICON model predictions were posted on the NRL web site, and were used by the AESOP group (Ramsay Harcourt) for surveys planning. • RUN 2 (only glider data assimilation)was started from RUN1 on July 19th with assimilation of glider data from SIO gliders, and later from WHOI gliders. • RUN 3 (glider, aircraft, ship, AUVs data assimilation) was started from RUN2 on July 26th (with the first aircraft survey) with assimilation of aircraft SSTs surveys and later (August 1, ROMS and HOPS came on line) with assimilation other data types. • Model outputs were provided to the MB2006 data base, and were plotted on the ASAP Collaborative Ocean Observatory Portal (COOP) web site. NRL Web page provided real-time products from the hierarchy of different resolution data assimilating models. • Comparisons of RUNS 1-3 provide possibility to evaluate in REAL-TIME the impact of glider data assimilation on the model predictions.
Impact of glider data assimilationComparisons of NCOM ICON and observed SSTs at M1 ASAP box Wind at M2 Upwelling Relaxation Upwelling
Adjoint sensitivity maps M1 Upwelling Relaxation
Impact of glider data assimilation Comparisons between Aircraft and NCOM ICON model SSTs. NCOM ICON SST NCOM ICON SST Aircraft SST With assimilation only gliders With assimilation gliders and other assets Aug. 8 Upwelling Aug. 5 Relaxation
Comparisons satellite-observed and NCOM model-predicted SST and Chlorophyl. 8 Aug 9 Aug
ASAP BOX HEAT STUDY Heat flux semi-diurnal variability ~ 104 W/m2 [MJ/cm2] 24 hour averaged heat flux variability ~ 103 W/m2 COAMPS surface heat flux diurnal variability ~ 102-103 W/m2 24 hour averaged COAMPS surface heat flux variability ~ 102 W/m2
What is next? OBJECTIVES • How much dynamical variability of the environment can be predicted and explained with the model assimilating gliders surveys? • Simulate the typical situation of the Navy operations in areas with restricted access: nested fine resolution coastal models are initialized from larger scale operational models and products, and glider surveys are used for assimilation. • Optimization of sampling strategies with gliders. • Study of the Ano Nuevo upwelling center heat/mass budget based on observations and models. • Study of coupled bio-optical-physical processes. APPROACH • Conduct hindcast experiments with assimilation of “latest-the-greatest” QCed observations. • Continue evaluation of real-time predictions and compare them with hindcast runs • Data denial experiments. Evaluate effectiveness of observations provided by various assets. • Virtual Pilot Experiments of sampling strategies optimization with dynamical control of gliders. Integrate the model predictions into algorithms and software for the dynamical control and coordination of gliders.
Future Plans NRL 5 year project: Bio-Optical Studies of Predictability and Assimilation for the Coastal Environment (BIOSPACE , Oct. 2007 –Oct. 2012) Objectives:Improve our understanding of • Coupled bio-optical and physical processes in the coastal zone • The variability and predictability of the coastal ocean’s optical properties on time scales of 1-5 days, i.e., the time scales of accurate atmospheric forecasts. Test area: Monterey Bay Planned experiments:FY2008 and FY2010
Goal: Real-time Coupled Ocean Prediction Systems Remote Sensing-Physical Remote Sensing: Bio-optical Atmospheric Prediction System Data Assimilation Ocean Hydrodynamic Thermodynamic Prediction System Ecosystem Model Bio-Optics Module Coupled Bio-physical
BIOSPACE NRL Field Program FY08 • Observational assets • 4 Slocum Gliders • Continuous profiles to maximum depth of 200m • T, S, fluorescence, backscattering, attenuation, current speed • Scanfish • CTD, spectral backscattering, absorption • Complements high spatial and temporal sampling • Will participate in both survey and adaptive sampling modes • SEPTR Real-time bottom-mounted Profiler • Examine • Vertical structure of Physical, optical/bio-optical properties • Relationship to Satellite vertically integrated measurements • Space-time variability of physical-bio-optical properties • Sampling strategies