Download
1 / 15
150 likes | 301 Views
Connections between P load and Microcystis bloom trigger points in the Maumee and Sandusky rivers. David Culver, Joe Conroy, Darren Bade, Doug Kane, and Bill Edwards. Site locations: 2009 2010. M4. M3. S4. M2. S3. M1. S2. S1. M7. M5. M6. M1. S7. M2. M4. S6. M3. S5.

E N D
Connections between P load and Microcystis bloom trigger points in the Maumee and Sandusky rivers David Culver, Joe Conroy, Darren Bade, Doug Kane, and Bill Edwards
Site locations: 2009 2010 M4 M3 S4 M2 S3 M1 S2 S1 M7 M5 M6 M1 S7 M2 M4 S6 M3 S5 Lost Creek Honey Creek S4 S2 S1 S3 Silver Creek
Measurements Physical: Temperature, DO, Secchi, Light Absorbance, Photosynthetically active radiation (PAR), volatile/non-volatile solids Chemical: TP, TDP, SRP, TKN, NO3, NO2, NH4, SiO2 Biological: Chlorophyll a, phycocyanin Phytoplankton density and biomass to genus Phosphorus uptake rate
2009 Microcystis Biomass • 1970 cyanobacterial biomass in Lake Erie = 1 g m-3 • April 2009 trib. Microcystis biomass = 0.00–0.85 g m-3 • No samples without Microcystis!
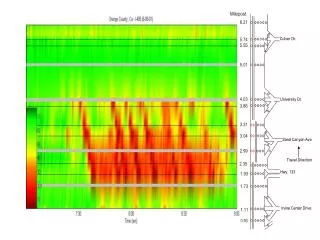
Ballville 10 Fremont 20 Fort Seneca 30 Tiffin 40 Melmore50 Waterville 30 40 Napoleon 50 60 Defiance 70 80 Apr Jun Aug Oct 2010 Total P (mg P/l) Sandusky Maumee Ballville 10 Fremont 20 Fort Seneca 30 Tiffin 40 Melmore50 Apr Jun Aug Oct
2010 Soluble Reactive P (mg P/l) Maumee Sandusky W’ville 30 40 Napol. 50 60 Defiance 70 80 Ballville 10 Fremont 20 Fort Seneca 30 Tiffin 40 50 Apr Jun Aug Oct Month Apr Jun Aug Oct
Conclusions • Microcystis in drainage ditches in April • Microcystis often ~100% of phytoplankton, especially in June and July in the rivers • Microcystis blooms when P not limiting • Microcystis blooms during high flow
Works in Progress • Light limitation estimates • P limitation calculations • Primary productivity calculations • Algae and chemical fluxes to Lake Erie • Add LEAST, NOLENS, GLISTEN results • GLRI samples for OEPA, ODW 2011-2013
OSU: Joshua Graham, Theo Gover, Maria Takahashi, Kyla Hershey, Amanda Martyn, Cathy Doyle Kent State U: Curtis Clevinger, Heather Kirkpatrick Heidelberg U: National Ctr. Water Quality Research. Funding: Acknowledgements