Common ways to sample Populations
Common ways to sample Populations. Quadrat survey Random walk Line transect Point survey Mark and recapture Traps and passive collecting. Quadrat survey. Spatial subsampling, most often used with plants or fixed things such as corals, nests, burrows etc.

Common ways to sample Populations
E N D
Presentation Transcript
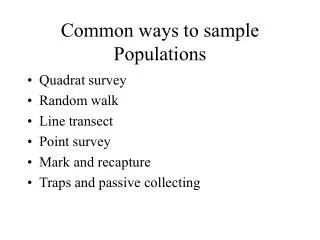
Common ways to sample Populations • Quadrat survey • Random walk • Line transect • Point survey • Mark and recapture • Traps and passive collecting
Quadrat survey • Spatial subsampling, most often used with plants or fixed things such as corals, nests, burrows etc. • Square area (can be any size dependent on organism) in which all individuals are documented. • Placement of quadrat can be random, or in area chosen because it is representative of larger community.
Common quadrat sizes used in ecology 0.1 used for quick and dirty forest census 5m quadrat rocky intertidal surveys, and seedlings. 1m quadrat used for intertidal and herbaceous plants including seagrass 50 ha used for long-term forest demographies 1 ha forest inventory
Determining size of quadrat Document species number with incremental increase in quadrat area Spp. No. Where diversity levels off is ideal area for quadrat. Area
Random walk/swim • Spatial subsampling. • Predetermined distance and compass bearings (random). • Document target organisms encountered.
Point Survey • Spatial subsampling • Randomly selected points (or could be regularly spaced along line transect). • Document all target organisms within given radius (varies according to organism).
Line transect discontinuous • Spatial subsampling. • Line located either randomly, or specifically to cross an environmental gradient (e.g. along a line from the shoreline straight out across a series of tidepools to the ocean). • Sample continuously or at intervals along the line.
Example: sampling butterflies • Recorder walks along a predetermined linear path at a uniform pace • Butterflies counted within 5 m of counter • Types subdivided as far as possible • Counting conducted between 10:45 and 15:45.
Standardized formula for site-to-site comparisons • P= (100 NA)/L, where P=population index, L = length of transect in meters, A = size of flight area in hectares, and N = butterfly numbers per 100 m of transect.
Point-quarter survey • Orientation of one axis can be chosen by random number (0-180o). Then distance to nearest individual is measured in each quarter. • Other documentation, e.g. species, dbh, sex, length, etc noted.
Mark and recapture • Catch N number of a popn at time 1. • Mark them (paint, clipped toes, tags) • Return at time 2 and resample same number from popn and count the number (M) that are marked (i.e. recaptured) • Total population P = na/r • Where P= total population, a= marked, n= total recaptured, r= marked recaptured
Major assumptions of mark and recapture • (i) marking doesn't affect animals (behaviorally, physiologically, or ecologically); • (ii) marked animals are completely mixed in population; • (iii) probability of capturing a marked animal is the same as capturing an unmarked animal (closed population); • (iv) marked animals don't lose their marks; • (v) marked mix naturally with unmarked.
Passive collectors • Pitfall traps for small reptiles and beetles • Large bucket for lizards with drift fence to guide critter into bucket. Must be emptied daily • Can half-filled with glycol and water preserves insects. Can be left out for a week, but may inadvertently catch small mammals and reptiles.
Cover boards • Sheets of plywood scattered across ground provide shade and resting habitat for snakes and moisture loving inverts.
Light or Black-light trap • UV light source shone against white sheet attracts a diversity of moths and night-flying beetles. • Can catch and kill everything (wasteful) • Or try to capture representative samples. • Monitor populations
Plankton sampling • Lateral or vertical tow of plankton net for known distance to gain planktonics. What variables need to be considered? • Scraping of known surface area of substrate to sample attached/settled organisms.
Soil fauna sampling using Berlese funnels • Soil fauna migrate away from light or heat. • Shovel leaf litter into a sieve and shine a light from above. Place catching tray beneath and wait for inverts to come tumbling out.
Common types of experiment • Exclosures • Reciprocals • Additions • Growth responses
Exclosure experiments • Trying to measure the effect that one organism has on a system. Try getting rid of the organism. • Hunt them out and then keep them out using Exclosures. • Then monitor changes in other populations or habitat.
Cattle exclosure: What differences do you see? No cattle Cattle present
Rabbit exclosure • Rabbits were excluded from the grassland area on the left and allowed to graze the area on the right. What would be the impact of a fish exclosure?
Fish excluded from an area • What might the impacts be? • Why might you want to do this? Fish exclosure at Otter Lake Dr R. Newman, U. Minn.
Reciprocal experiments • Observation The same species of plant grows in two locations, but the ones at location A do better than at B. • Q: Is this pattern because the popn at A is better suited to conditions (evolutionary adaptation) or because location A is a better site? • Can test this by taking members of popn A and planting them at B, and taking some from B and planting at A. What happens?
Growth response experiments • Nutrient effects…..does factor X enhance growth. Grow species A under a range of concentrations of X. • Toxicity effects…..is survival (or growth) impaired by factor Y. Expose species A to various concentrations of factor Y. • LD 50 studies: determines the dose (mg/kg) at which 50% of individuals die within a given time-frame.
Rank these according to their lethality, most lethal at top • Nicotine - cigarettes • Malathion - commonly used for mosquito control • Diazinon - commonly used to kill lawn insects • Salt • Sevin - Insecticidal dust • Sodium hydroxide - drain cleaner • Household Ammonia - Bleach
Compound Oral LD50 LD50 mg/kg (g/70k person) • Nicotine 50-55 2.5 g • Diazinon 300 15 g • Ammonia 350 18 g • Sodium Hydroxide 500 30 g • Carbaryl (Sevin) 500 30 g • Malathion 1,375 80 g • Salt 3,000 (Rat) 200 g
Essence of good experimental design • Simplicity • Tractability • Controls • Replicates
Common ways to look at behavioral ecology • Continuous recording, e.g. satellite tracking an individual. • Time sampling, e.g. time lapse photography. • Must choose frequency of sampling appropriate to behavior.
Time-sampling • Choose a time period, e.g. one minute and record 1 (0) if the activity occurred (did not occur) within that minute. • More open-ended. Choose a sampling interval say 10 minutes and observe what the organism is doing every ten minutes. e.g. preening, swimming, mating, feeding, fighting, etc. After enough observations the proportions of activities can be determined. What variables might shape such activity, say in lizards?
What behavior to measure • Latency: delay until activity occurs • Frequency: How often activity occurs in set time. • Duration: How long the activity was maintained. • Intensity: The strength of the behavior (note this is more subjective than the others).
Measuring behavior is a skill • Like any skill it needs to be learned. • Surest way to fail is to start recording without taking the time to observe. • Spend at least 30 minutes (or several cycles of a behavior pattern) observing the range of behavior before starting to record field data. Garbage in -> garbage out.
Data sheet Location, date, observer, field observations, e.g. weather, temp,time of day, size of group observed, etc Activity type
Sampling at a larger scale • Data mining: Use resources in existing databases. • Access satellite imagery and analyze using Geographic Information Systems (GIS)
Layers Vector Layers Street Network layer: lines Land Parcels layer: polygons Raster (image) Layer Digital Ortho Photograph Layer: Digital Ortho photo: combines the visual properties of a photograph with the positional accuracy of a map, in computer readable form. Projection: State Plane, North Central Texas Zone, NAD 83 Resolution: 0.5 meters Accuracy: 1.0 meters Scale: see scale bar


![Best Ways To Overcome Common Link Building Blockers [Explained]](https://cdn4.slideserve.com/7928313/best-ways-to-overcome-common-link-building-blocker-dt.jpg)