Metric System
Metric System . International System of Units (SI). International System . The international System – SI units, in multiples of TEN, provide a standard of consistent measurement for global science, business, and industry. Basic Metric Units. Length. Meter (m) Gram (g) Liter (l)


Metric System
E N D
Presentation Transcript
Metric System International System of Units (SI)
International System • The international System – SI units, in multiples of TEN, provide a standard of consistent measurement for global science, business, and industry
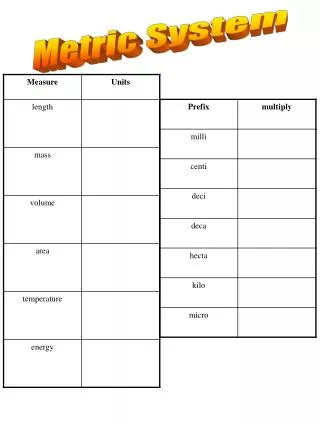
Basic Metric Units Length Meter (m) Gram (g) Liter (l) Celsius (°C) or Kelvin (K) Second (s) Newton (N) Change over time Mass Volume Temperature Time Weight Rate
LENGTH • Length-distance between two points • Measure pencil – use centimeters • Measure distance from New York to Chicago – use kilometers • METER is the basic unit of length
VOLUME • Amount of space an object takes up; SI unit – cubic meter (m3 ) • To find volume of regular shape – measure length, width, and height and multiply them all • To find volume of irregular shape – volume by immersion
MASS • Amount of matter in an object • SI unit = kilogram • One liter of water has a mass of about 1 kg • Smaller masses are measured in grams (g); one gram is about the mass of a large paper clip
WEIGHT • Measurement of force • SI unit = newton (N) • Weight depends on gravity, which can change depending on where the object is located • Where would you weight more……on Earth or on Mars??
TEMPERATURE • Measure of kinetic energy in particles of matter; SI unit – kelvin (K) • Other measurements of temperature include degrees Celsius and degrees Fahrenheit
TIME • Interval between two events; SI unit = second (s) • Rate is the amount of change of one measurement in a given amount of time • E.g. Speeds are often measured in kilometers per hour or miles per hour
Derived Units • Area – amount of surface included within a set of boundaries; expressed in square units of length, e.g., m2 • Volume – amount of space occupied by an object, e.g., m3 for solids or mL or L for liquids • Density – amount of matter that occupies a given space; mass/volume, e.g., g/mL
Basic units: m, l, g ManyMmega1 000 000(106) Kidskkilo1000(103) Havehhecto100(102) Droppedda/dkdeka10(101) Over--- Basic Unit (ONES)---1 (100) Deadddeci.1(10-1) Convertingccenti.01(10-2) Metricsmmilli.001(10-3) ----- m micro .000001 (10-6) ----- n nano .000000001 (10-9) ----- A Angstrom .0000000001 (10-10)
Bigger to smaller - Move decimal right Smaller to bigger - Move decimal left 3 3 3 100 (m, l, g) Basic Unit M k h da d c m μ n Many kids have dropped over dead converting metrics 4.22 422. cm = m 6523. m m = 0.006523 m 69630 ml 69.63 l = 13 dal = 130,000 ml 0.00923 kg 230 mg = 0.230 g 9.23 g =
Celsius The Metric Temperature Scale • Definitions • 0°Celsius(C) = 32°Fahrenheit(F) = water freezes • 100°Celsius = 212°Fahrenheit = water boils • Also called the centigrade scale. • Conversions • °Celsius = 5/9 X (°Fahrenheit - 32°) • °Fahrenheit = (9/5 X °Celsius) + 32° 30 is hot, 20 is nice, 10 is chilly, 0 is ice.
REVIEW “QUIZ” 1) 345 cm = km 0.00345 2) 22ºC = 71.6 ºF 3) k h da (m,l,g) d c m kilo- hecto- deka- deci- centi- milli- Fill in the missing prefixes.
Drawings, Tables, and Graphs • Scientific Illustrations – often make information more clear than written text can • Drawings: can emphasize only necessary details or show things you can’t see • Photographs: show an object exactly as it is at a single moment • Tables – display information in rows and columns for easier comprehension
Drawings, Tables, and Graphs • Graphs: collect, organize, and summarize data visually • Line graph –shows relationship between two variables, which must be numbers • Bar graph – uses bars of different sizes to show relationships between variables; one variable is divided into parts; the other variable is a number
Drawings, Tables, and Graphs Graphs: collect, organize, and summarize data visually • Circle graph – shows parts of a whole as percentages • Scales on graphs must be carefully constructed and analyzed so users easily understand the info
What Kind of Graph is This? LINE GRAPH
What Kind of Graph is This? Circle Graph
What Kind of Graph is This? Bar Graph